Stop the AI Tool and scraper madness – Set up Cloudflare today and watch expensive automated traffic disappear [Case Study]
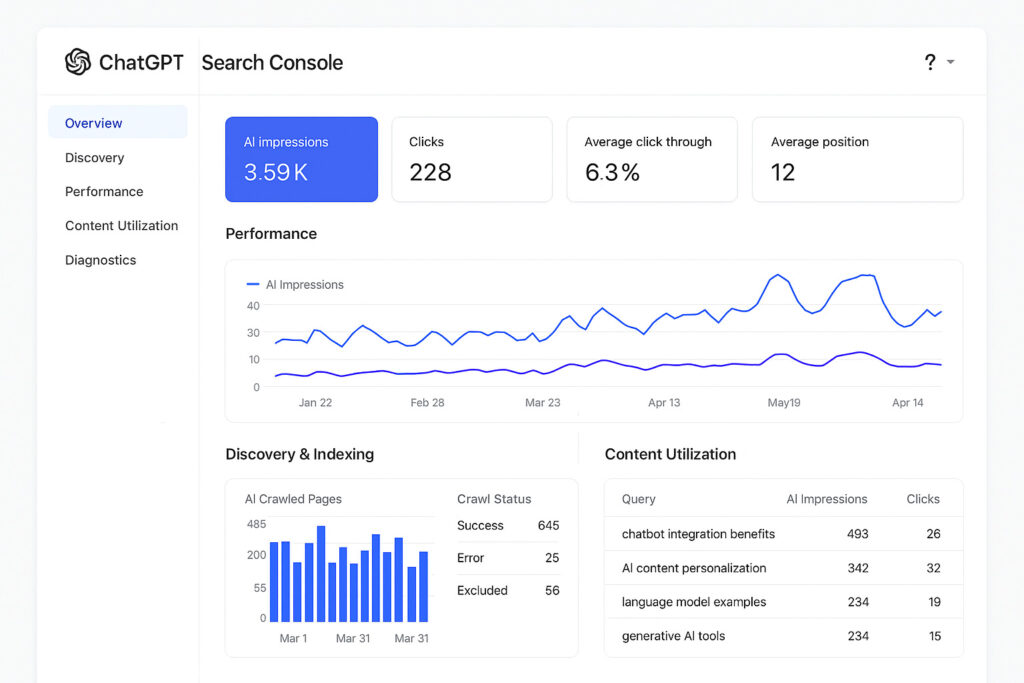
I cover the absolutely insane, frustrating, and expensive AI tool, bot and scraping situation and what site owners can do right now to mitigate the problem. You’ve likely heard about the crazy amount of crawling going on by AI scrapers, AI search tools, bots, and others now that AI Search has arrived. But have you … Read more