
Google’s Web Stories, previously called AMP Stories, can provide an immersive AMP experience across both desktop and mobile. Google has been pushing them hard recently and stories can rank in Search, Google Images, and in Google Discover. On that front, Google recently rolled out a Web Story carousel in Discover, which can definitely attract a lot of eyeballs in the Discover feed. And those eyeballs can translate into a lot of traffic for publishers.
I’ve covered Web Stories heavily over the past year or so and I’ve written a blog post covering a number of tips for building your own stories. I have also developed several of my own Web Stories covering Google’s Disqus indexing bug and the upcoming Page Experience Signal.
Building those stories by hand was a great way to learn the ins and outs of developing a story, understanding the functionality available to creators, the limitations of stories, and how to best go through the life cycle of developing a story. As I explained in my post covering various tips, it’s definitely a process. Planning, creativity, and some technical know-how go a long way in developing an engaging and powerful Web Story.
From a feedback perspective, analytics can help creators understand how well their story is being received, if users are engaged, and how far they are progressing through a story. Unfortunately, that has been challenging to understand and accomplish for many publishers starting off with Web Stories. And that situation has led me to research a better way to track stories via Google Analytics. That’s what I’ll be covering in this post. By the end, you’ll be tracking Web Stories in a more powerful and granular way. I think you’ll dig it.
Analytics for Web Stories – Confusing For Many Creators
From the start, it seemed like analytics took a back seat for stories. There wasn’t great documentation about how to add analytics tracking and the WordPress plugin originally didn’t even have the option for including tracking codes. That changed recently, which was great to see, but questions still remained about how to best track Web Stories. For example, can you use Google Tag Manager, can you add advanced tracking to understand more about how users are engaging with your story, can you track specific elements in your story, etc.?
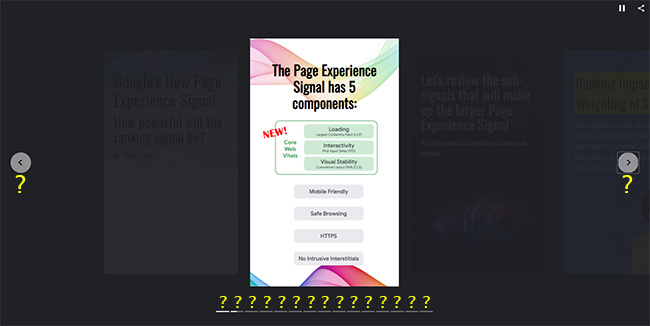
After looking at basic metrics for my stories in Google Analytics (yawn), I went on a mission to enhance my story tracking setup. Unfortunately, there’s still not a one-stop resource from Google for tracking Web Stories (hint-hint Paul Bakaus), but I was able to dig into various documents and articles and figure out a pretty cool solution that’s easy to set up. I’ll provide that setup below so you can start tracking your own stories in a more powerful and granular way.
Tracking User Progress Through A Web Story: A Simple Goal
If you just add a basic tracking code to your story, you will at least know how many people are viewing the story and gain basic metrics for the page (just like any other page in Google Analytics). But that doesn’t really do Web Stories justice…
Web Stories are a unique combination of pages within a story. In other words, Web Stories string together multiple pages, which make up the larger story. Users can click back and forth to view each page within the story. You can also automatically advance the user to the next page after a specific amount of time. And once a user completes a story, they are presented with a “bookend”, which is a final page that contains information selected by the creator.
With a basic tracking setup, Web Stories are like a black hole. People enter, and you have no idea what’s going on within the story. For example, how many pages have they viewed, how far are users progressing through the story, did they reach the bookend, how long did it take to get to the end, etc.?
Wouldn’t it be awesome to be able to track that information??
The good news is that you can, and it’s pretty easy to set up. Below, I’ll cover how to add the necessary tracking to your Web Stories so you can gain more information about how users are engaging with your stories. And beyond just setting up this level of tracking, I wanted to provide more information about how events and triggers work in stories so you can start testing your own advanced tracking setup. Let’s jump in.
Web Story Tracking: A Top-level View of What We Are Trying To Accomplish
Before I cover the tracking framework you can utilize today in order to better track your Web Stories, let’s cover the basic bullet points of what we are trying to achieve. Here is what we want to achieve:
- Track user progress through each Web Story you have published. i.e. Track each page within the story to understand how far users are progressing.
- Document the Web Story title and organize each page within the story so they can be tracked properly.
- Track when users reach the final page in your Web Story so you can identify how many users actually reach the end.
- Track when users enter your bookend, which is a special page at the end of your Web Story that contains social sharing and related links. It’s just another way to understand when users have reached the final part of your story.
For example, wouldn’t it be incredible to see the following? That’s a sample Web Story and data for each page within the story. Yep, this is what we want… let’s go get it:
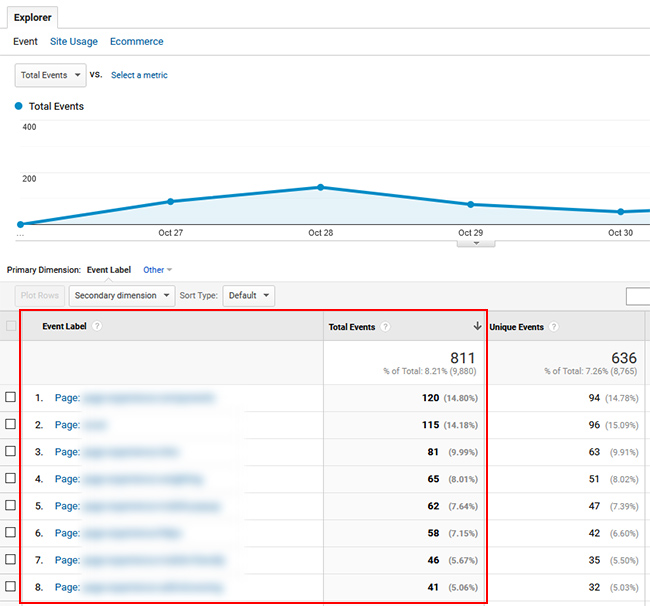
The Inner Workings: Events, Triggers, and Variables
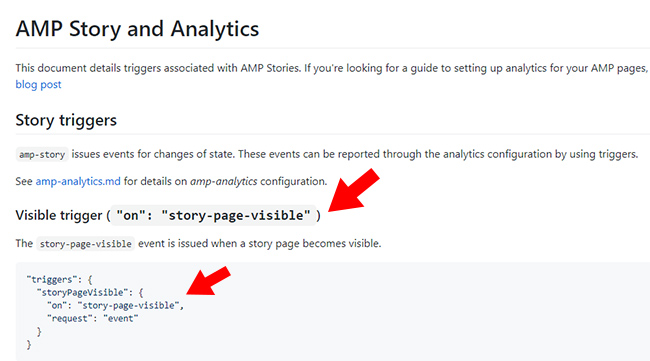
Every Web Story issues events as a user progresses through a story. For example, when a user progresses from one page to another within a story, the “story-page-visible” trigger fires every time a new page is loaded. You can capture an event like that and report it in Google Analytics using event tracking.
When sending those events to Google Analytics from within your story, you can provide the typical event parameters like event_action, event_category, and event_label so you can track your Web Story data in your GA reporting.
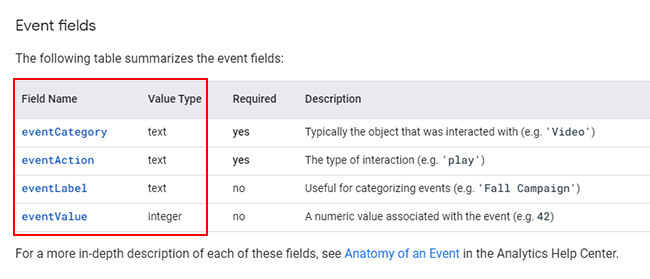
List of Web Story Triggers and Variables:
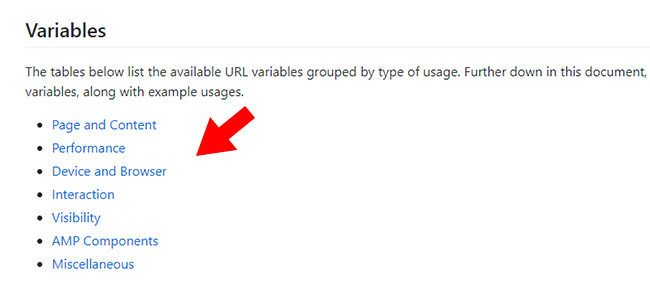
There are several triggers you can capture and a list of them can found on github for AMP Project/AMP HTML. In addition, you can view the variables available to you via AMP by checking out the AMP HTML Variable Substitutions page. Between the two documents, you can learn how to combine triggers and variables to set up advanced tracking.
A Template From The AMP Project!
During my research, I was excited to see that the AMP blog published a post about tracking Web Stories and it contained a skeleton structure for advanced tracking! For example, the post listed a code snippet for firing an event every time a user progresses from one page to another within a web story (to track user progress). We could use this snippet, and expand on it, to customize our tracking.
Here is an image from the AMP project’s blog post about tracking user progress. Again, this is exactly what we are looking to do.
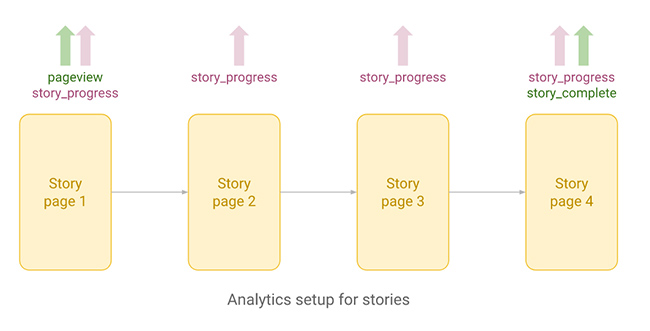
By using the right triggers and variables and then firing events from our Web Story, we can get a much stronger picture of user engagement. Below, I’ll provide the triggers and events we’ll use and then I’ll provide the final code later in the post.
Note, there are three triggers we’ll be capturing in our Web Story and we’ll fire an event when those triggers are captured.
- Trigger: story-page-visible. When each new page in the story loads, story-page-visible fires. When that fires, you will send an event to Google Analytics with the following variables.
- event_name: You can name this whatever you want. Event tracking in Google Analytics focuses on the following three fields.
- event_action: Name this something descriptive. For this example, we’ll use “story-progress” which is what the original blog post used covering this approach.
- event_category: For this field, I’m going to use a variable for Web Stories, which is the title of Web Story. The variable is ${title}, which is what’s present in your title tag. I linked to the variables available to you earlier in this post.
- event_label: For the final field, we’ll use both the page index value (page number) and ID for the page within the Web Story (which is the descriptive name for the page you provide in your story). This will enable us to see how many times a specific page within the Web Story is loaded by users. The variables are ${storyPageIndex} and ${storyPageID} and you can combine the two in your code. I added “Page: ${storyPageIndex} ID: ${storyPageID}” to combine both in your event reporting. It makes it easier to see the page number and then the ID associated with that page. BTW, thank you to Bernie Torras who pinged me on Twitter about storyPageIndex, which is a great way to capture the page number within your story.
Next, we want to know when users visit the final page of each Web Story. That can help us understand how many people are actually reaching the end. To accomplish that, we can add another trigger:
- Trigger: story-last-page-visible. Note, this is not the bookend. Instead, this is the last page in your story before the bookend is displayed. Story-last-page-visible fires when a user reaches that final page in your story before the bookend.
- event_name: You can name this whatever you want. Just like earlier, the reporting in Google Analytics focuses on the following fields.
- event_action: Name this something descriptive. For this example, we’ll use “story-complete” since the original blog post covering this tracking framework used that action name.
- event_category: Make sure to use the same event_category for this trigger as you did earlier to keep the various triggers organized by Web Story. The variable is ${title}. Then you can drill into a specific story in Google Analytics and view the actions and labels associated with that one story.
And finally, let’s add one more trigger to understand when users reach the bookend in your Web Story, which is a special page at the end that contains social sharing and related links. It’s just another way to understand that users made it to the very end of your Web Story. You’ll need to add one more section of code to your tracking script:
- Trigger: story-bookend-enter
- event_name: You can name this whatever you want. As I mentioned earlier, the reporting in Google Analytics focuses on the following fields.
- event_action: You can also name this whatever you want. For this example, let’s use story-bookend-enter.
- event_category: Like earlier, I’m going to use a variable for Web Stories, which is the title of Web Story. The variable is ${title}. Remember to keep the category consistent with each trigger so you can view all events within a single web story in your reporting.
By adding this setup, the event tracking reporting in Google Analytics will enable you to drill into specific stories, see the number of “pageviews” for each page within a story, know how many users are reaching the final page in a story, and then how many are viewing the story bookend. It’s a much stronger setup than just seeing a single pageview for your Web Story (AKA, the black hole of Web Stories).
Here is the final code based on what I mapped out above. Make sure you replace the placeholder GA account ID with your own:
<amp-analytics type="gtag" data-credentials="include">
  <script type="application/json">
	{
	  "vars": {
		"gtag_id": "UA-XXXXXX-X",
		"config": {
		  "UA-XXXXXX-X": {
			"groups": "default"
		  }
		}
	  },
	  "triggers": {
		"storyProgress": {
		  "on": "story-page-visible",
		  "vars": {
			"event_name": "custom",
			"event_action": "story_progress",
			"event_category": "${title}",
			"event_label": "Page: ${storyPageIndex} ID: ${storyPageId}",
			"send_to": ["UA-XXXXXX-X"]
		  }
		},
		"storyEnd": {
		  "on": "story-last-page-visible",
		  "vars": {
			"event_name": "custom",
			"event_action": "story_complete",
			"event_category": "${title}",
			"event_label": "${totalEngagedTime}",
			"send_to": ["UA-XXXXXX-X"]
		  }
		},
		"storyBookendStart": {
		  "on": "story-bookend-enter",
		  "vars": {
			"event_name": "custom",
			"event_action": "story_bookend_enter",
			"event_category": "${title}",
			"send_to": ["UA-XXXXXX-X"]
		  }
		}
	  }
	}
  </script>
</amp-analytics>
How To Add Your GA Tracking Script To A Web Story:
Once you have your tracking script ready, you need to add that to your Web Story code. I’ve been hand-coding my stories so it’s easy to have control over where the amp analytics tag is placed. In my stories, I place the amp analytics tag after the final page in my story, but before the bookend tag and the closing <amp-story> tag. If you place the amp analytics tag outside of your <amp-story> tag, the Web Story will not be valid. You can see the placement of my amp analytics tag in the screenshot below.
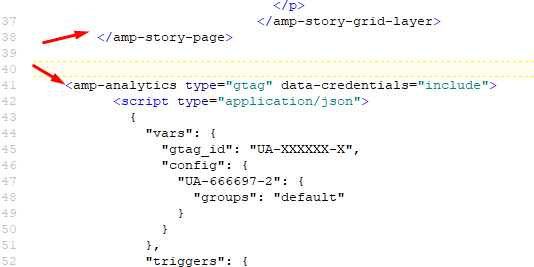
Make sure your amp-analytics tag is placed before the closing amp-story tag.
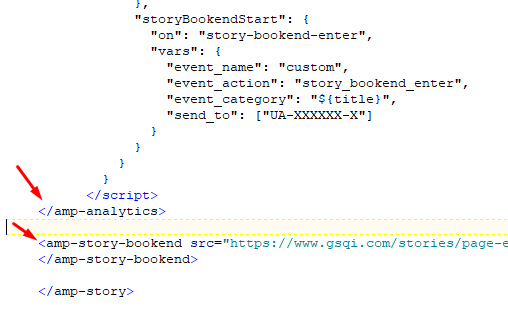
A Note About The Web Stories WordPress Plugin:
Again, I have been hand-coding my stories and haven’t dug too much into the WordPress plugin. I’ve heard good things about it, but I really wanted to learn the ins and outs of building a story, so I stuck with hand-coding my stories.
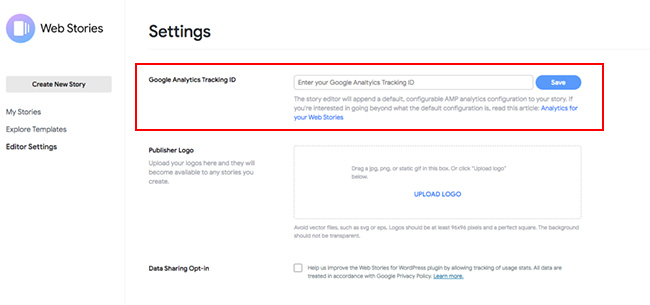
The WordPress plugin finally added the ability to easily include your Google Analytics tracking ID, but it doesn’t look like you can add advanced-level tracking easily (like what I’m mapping out in this post). I’ll reach out to the Web Story team to see if they will add the ability to accomplish this in the future, but for now I think you’ll be limited to the basic tracking I mentioned earlier.
{Update: WordPress Plugin Automatically Firing Events}
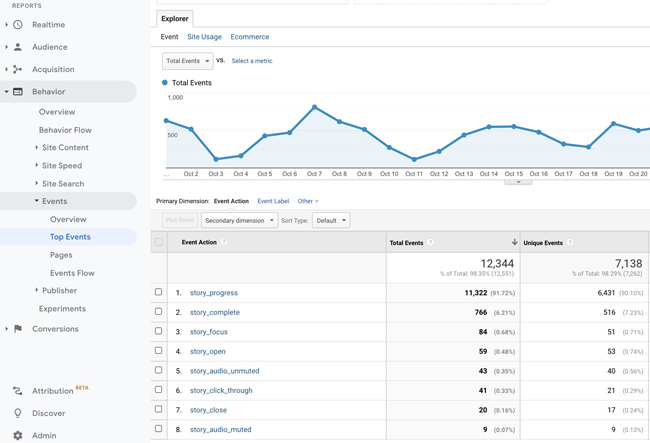
I have very good news for you if you are using the Web Stories WordPress plugin. Brodie Clark pinged me today after going through my post. He is using the Web Stories plugin, checked the Events reporting in Google Analytics, and noticed the plugin is automatically firing those events! That’s amazing news for any plugin users!
Again, I’ve been hand-coding my stories so I haven’t played around too much with the plugin. But that’s outstanding news, since plugin users can view user progress and a host of other events being fired within their stories.
Once you add your GA tracking ID, it seems the plugin is automatically capturing the data and firing events:
Here are the triggers being captured based on what Brodie sent me:
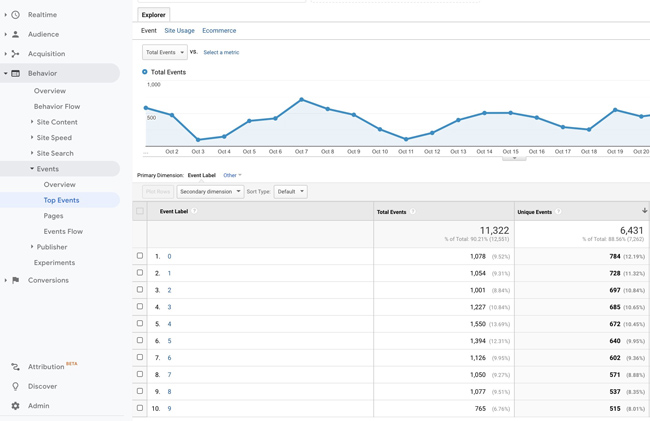
And here is what it looks like once you click into story_progress. The plugin is using storyPageIndex versus storyPageID so you can see the page number in the reporting. I’m thinking about combining the two actually.
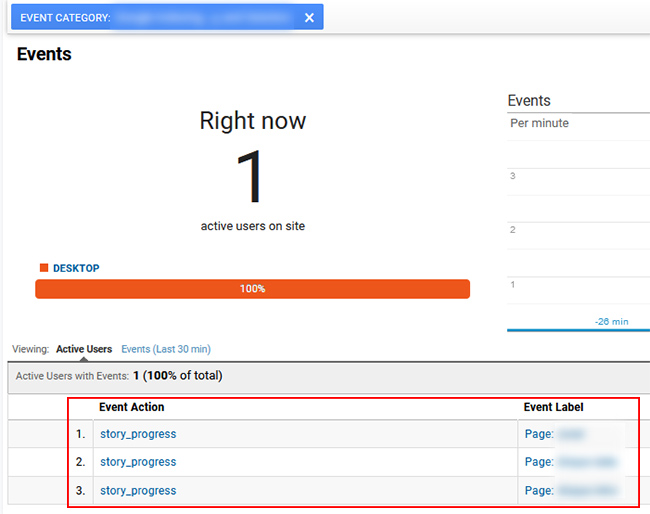
How To Test Your Tracking Via Google Analytics Real-time Reporting
The easiest way to test your new tracking setup is to upload your story to your site and view real-time reporting in Google Analytics. There’s a tab for Events, where you can see all of the events being triggered. Just visit your story and look for the various events, actions, and labels.
Viewing Web Story Tracking In Google Analytics:
Once your story is live that contains your new tracking setup, and users are going through your story, you can check the Events reporting within the Behavior tab in Google Analytics to view all of the events that have been captured. This is where the naming convention we used comes in handy. When you click “Top Events”, you will see the event categories listed. We used the story title as the category, so you will see a list of all stories where events were captured.
When you click into a story, you will see each action that was captured (each trigger that was captured as an event).

And by clicking an action, you can see the labels associated with that action. For example, story_progress enables you to see the list of pages that users viewed within your story and how many events were triggered for each page (helping you understand how far users are progressing through each story).
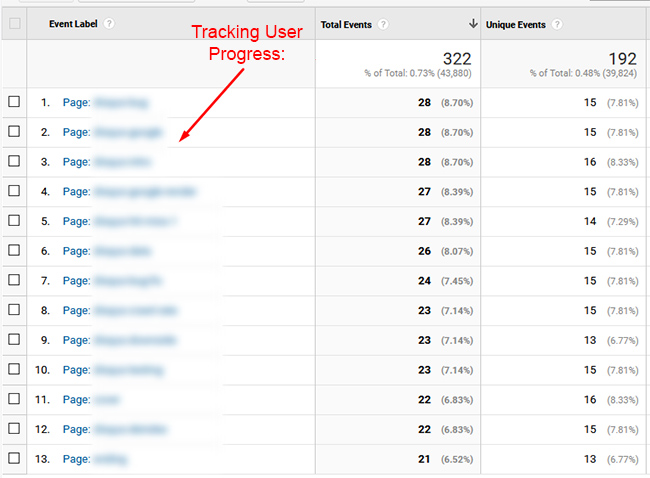
And there you have it! You can now track your Web Stories in a more powerful and granular way. It’s not perfect, but much stronger than the “black hole” approach of just basic page-level metrics. And remember, you can totally expand on this setup by adding more triggers and using the variables available to you.
Summary – Creep out of the black hole of Web Story tracking.
I hope you are excited to add stronger tracking to your Web Stories. As I documented in this post, you can creep out of the black hole of story tracking and analyze user progress through your story. By doing so, you can better understand user engagement and then refine your stories to increase engagement and user happiness.
So don’t settle for black hole reporting. With a basic level of understanding of event tracking, triggers, and variables, you can set up some very interesting tracking scenarios. Good luck.
GG
