
In 2013, I wrote a post explaining how to create what I called a Panda Report, which enabled you to identify landing pages seeing the biggest drop during a major algorithm update. The post explained how to do this based on Google Analytics data, but you can definitely do the same thing with GSC data (and with queries in addition to landing pages).
Well, it’s 2021, the process I use has been enhanced, and I wanted to publish a new post explaining how to automate the process using Analytics Edge. First, since medieval Panda is now missing in the SEO trees, the report needed a new name. For the past several years, I’ve simply called it a Delta Report. That fits much better since you can use this approach to identify the change in impressions, clicks, or rankings based on any event impacting Search (like a broad core update, a site migration, website redesign, or any other situation causing volatility). By identifying the landing pages and/or queries seeing the biggest drop, you can often find glaring issues. It’s a great way to start digging into the data after a big drop or surge in rankings and traffic.
And beyond the name change, there are some great ways to bulk export data via the Search Console API now. Since the GSC UI limits exports to just one thousand rows of data per report, using the Search Console API is critically important for exporting all of your data. For example, I often use the API to mass-export landing pages and queries from GSC (going well beyond the one thousand row limit).
A Delta Report is a Panda Report on Steroids – The Power of Analytics Edge and APIs
I have covered Analytics Edge a number of times before in blog posts about exporting data. It’s an add-on for Microsoft Excel that quickly and efficiently enables you to bulk export data via the Search Console API, Google Analytics API, and more. But that’s not all you can do with Analytics Edge. Beyond just the export, you can create macros that filter and organize the data to create advanced reports (so you can export, compare, filter, etc. and all in one shot).
For our purposes, that means exporting all queries or landing pages, comparing the data based on timeframe, filtering based on your site structure, important query types, etc., and then writing those exports to their own worksheets for further analysis. And this is all done in one shot based on the macro you create (build once, use often).

Excited? Below, I’ll walk you through the process of creating the macro via Analytics Edge. And while you go through this tutorial, you’ll probably think of 100 other things you can use Analytics Edge for while working with data. It’s basically a Swiss Army Knife for working with APIs.
How to export GSC data via the Search Console API, compare data across timeframes, filter the data by page or query type, and create separate worksheets, all in one shot:
First, there are some requirements. Although Analytics Edge isn’t free, it’s extremely cost-effective. The core add-in costs $99 per year and the GSC connector costs $50 per year. Also, the good news is that there is a 30-day free trial so you can walk through this tutorial and use the process for 30 days to see how it works for you.
So, for $150 per year, you can use Analytics Edge to your heart’s delight. If you are helping larger sites where the API is necessary to export all of your data, then Analytics Edge is a great way to go, and it definitely won’t break the bank.
How To Create A Delta Report: Step-by-step instructions
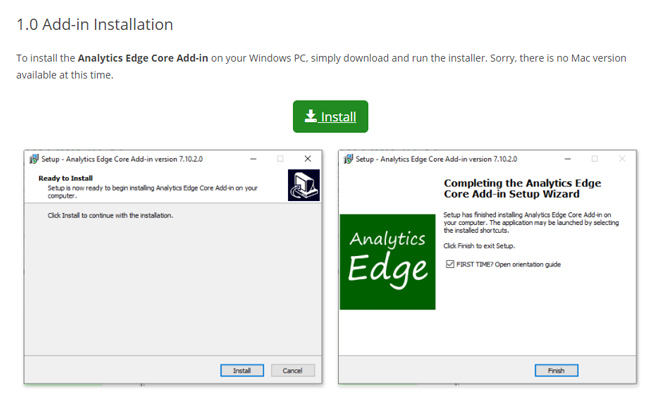
1. Download and Install Analytics Edge (Core Add-in):
You can download and run the Analytics Edge installer to quickly install the add-in. After installing the add-in, click the license button and accept the Terms of Use. Once you do, a 30-day free trial will start for the core add-in.
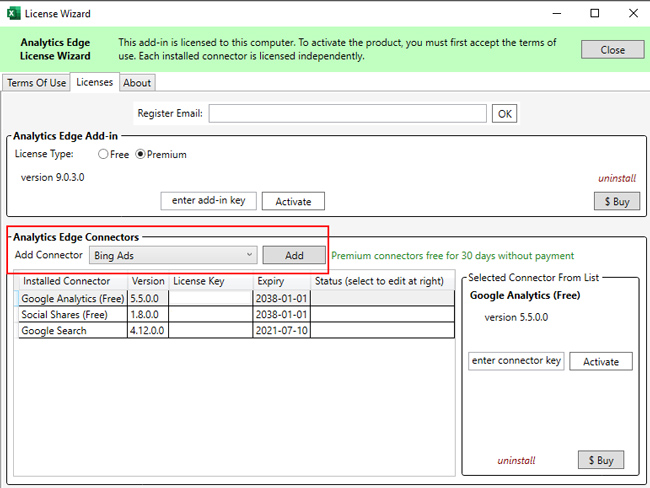
2. Install the GSC Connector from within Excel:
Now that the Core Add-in is installed, you need to add the GSC connector so you can work with the Search Console API. It’s very easy to install the connectors available in Analytics Edge. Simply click the License button in the Analytics Edge menu and then click the dropdown to add a new connector. Select Google Search and then click Add. Then click Install. Once the connector is installed, a 30-day trial will begin for that connector.
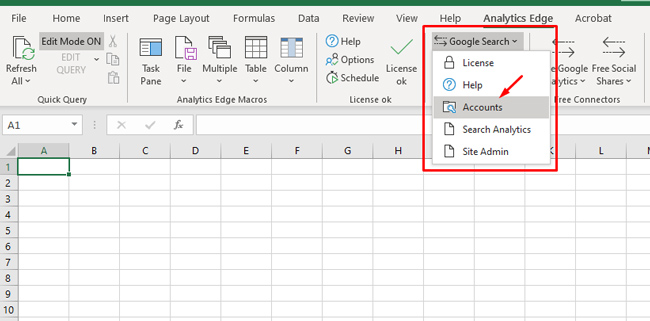
3. Connect Your Google Account:
In order to export data from your GSC properties, you first need to connect your Google Account associated with those properties. Once you set this up, you will not need to do this over and over. And you can add multiple Google Accounts if you have access to GSC properties across various accounts. Click the Google Search dropdown in the Analytics Edge menu and select Accounts. Click Add Account and walk through the process of quickly connecting your Google account. Once you do, you’ll be able to use the API to connect to any property you have access to.
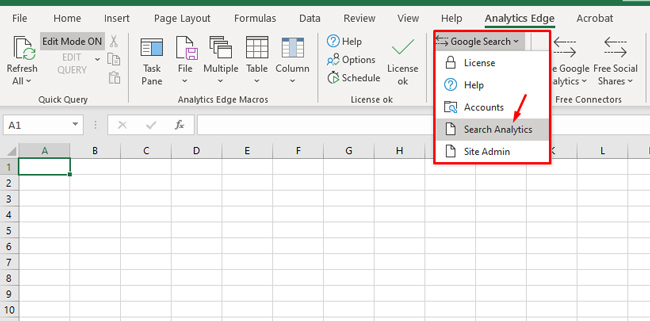
4. Create Your Macro – Exporting All Landing Pages or Queries and Comparing Data Across Timeframes:
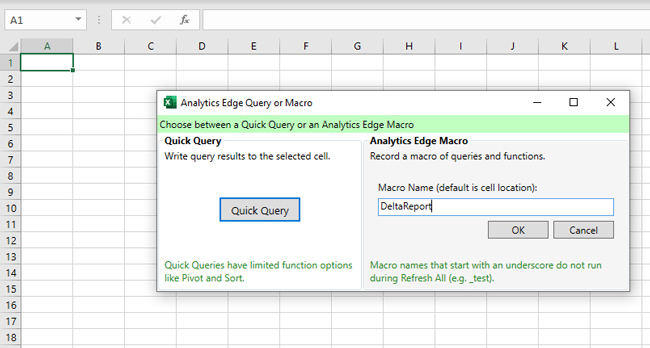
Let’s start creating our macro by exporting all landing pages and comparing data across timeframes. In a real-world situation, you would compare the timeframe after a major event (like a broad core update) to the previous timeframe to see the changes per landing page or query. But for this tutorial, we’ll keep it simple. Let’s just pull all landing pages for the last 28 days and compare to the previous timeframe. Once you get the hang of this, you can customize the report for each situation you encounter. Note, if you ever lose the Macro window, just click “Task Pane” in the Analytics Edge menu in Excel. It will show back up on the right side of the spreadsheet. Let’s start creating our macro. Go ahead and click Analytics Edge in the main menu, then Google Search, and then Search Analytics. Name your macro DeltaReport (or whatever you want).
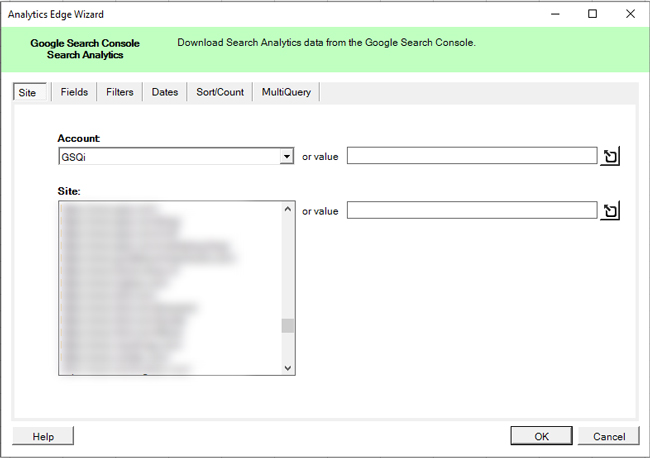
5. Choose The Account and GSC property:
Select the Google account you want to use and then select the GSC property in the site list.
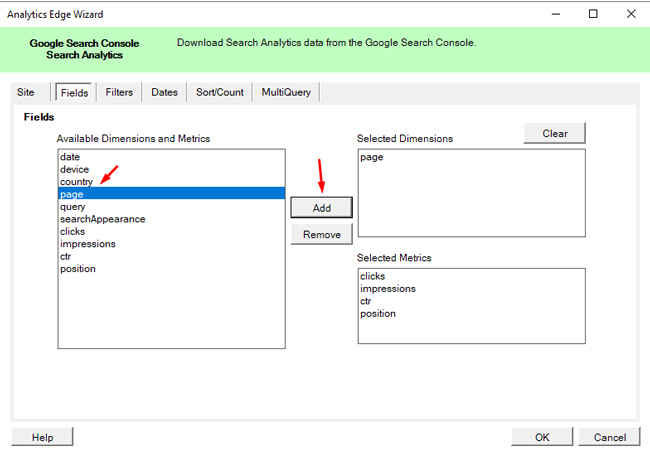
6. Select Fields To Export:
In the available dimensions and metrics list, select page and click “Add” to export all landing pages from Google organic Web Search. Leave the selected metrics as-is (with clicks, impressions, ctr, and position all selected).
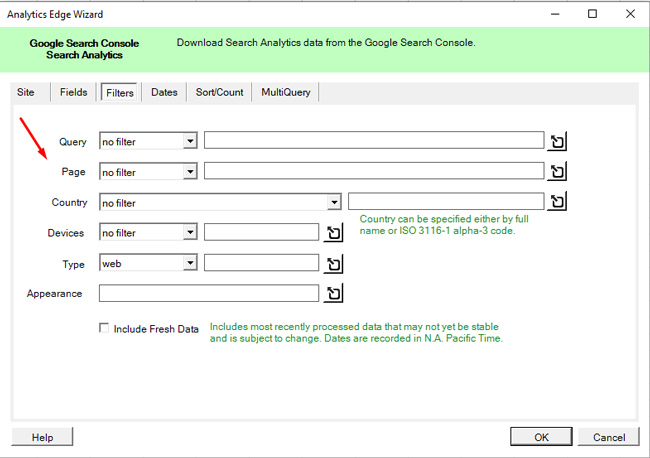
7. Leave Filters Tab As-Is, But Review The Settings:
For this tutorial, we’ll leave the filters tab as-is, but note the options you have here while exporting data from GSC. You can filter by page, query, country, device type, search type, and search appearance. You’ll notice the default search type is Web Search. That’s what we want for this specific report, so keep the default settings.
8. Select A Date Range – Comparing Data Across Timeframes Made Easy:
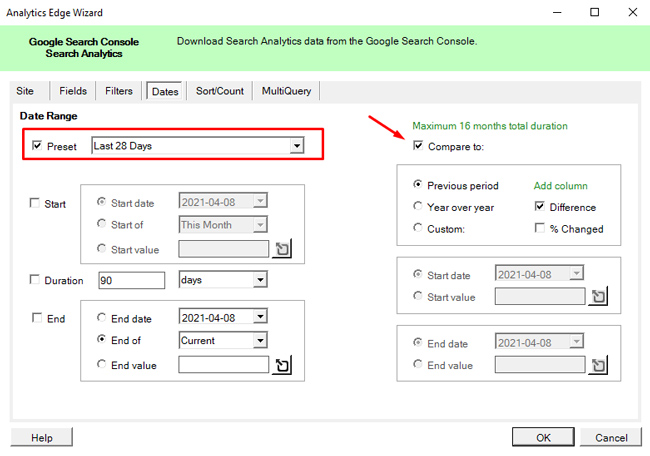
Depending on your situation, select the appropriate timeframe for exporting data. For this tutorial, let’s pull the last 28 days of data and compare to the previous timeframe. Click the Dates tab and simply use the dropdown to select Last 28 Days. To compare timeframes, make sure to select the checkbox for “Compare to” and select a timeframe to compare with. To keep things simple, we’ll just select “Previous period”.
9. Sort By Clicks Or Impressions:
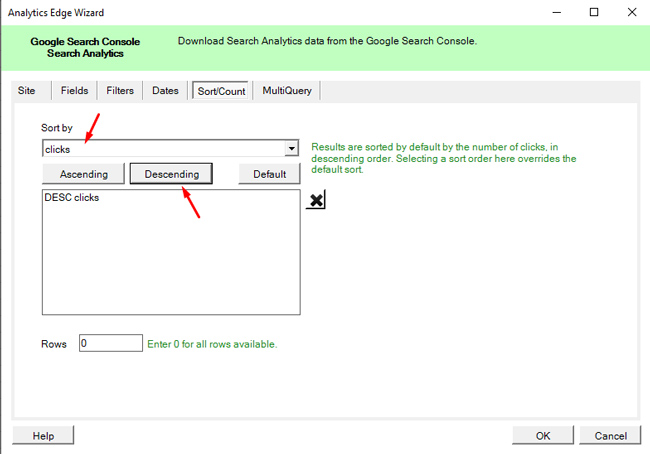
Under the Sort/Count tab, use the dropdown to select a metric to sort the data by. I typically choose clicks in descending order. Make sure to click the button labeled “Descending” to apply the sort preference.
10. Run The Query!
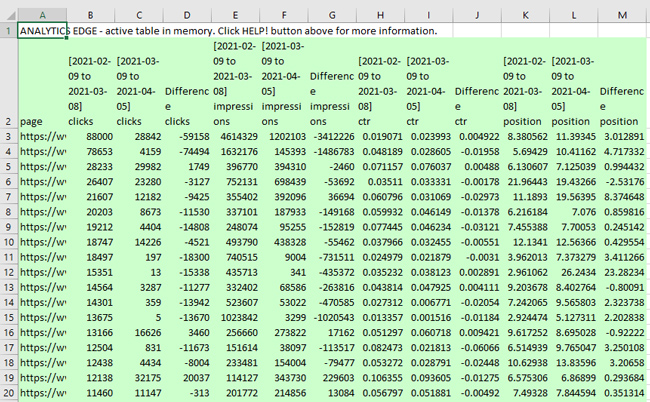
Click OK in the bottom right corner of the wizard to run the query. Depending on how much data needs to be exported, it can take a few seconds (or longer). Once the query has completed, you will see the results highlighted in green. Note, this does NOT show the full results from the export. Analytics Edge just shows a sample of the results and is waiting for more input from you (either to write the full data to a worksheet now or to use the built-in functions to create more advanced reports).
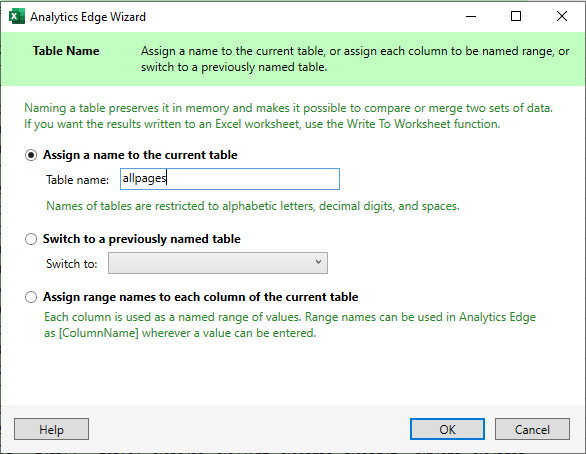
11. Set The Table Name:
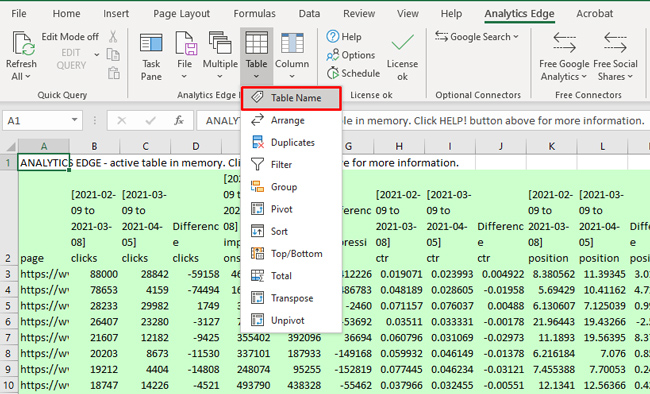
Since we’ll be filtering the data we just exported multiple times (by page type), we need to set the table name so we can come back to the full data in future steps. To do this, click the Table dropdown in the Analytics Edge menu and select Table Name. Set the table name to something like “allpages” and click OK. Again, we’ll need this in the future.
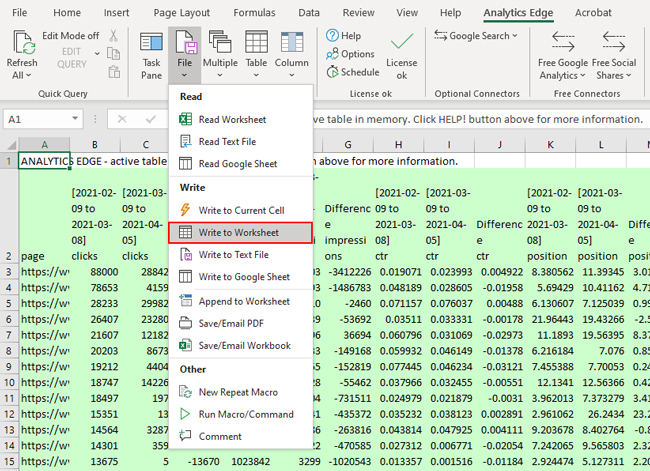
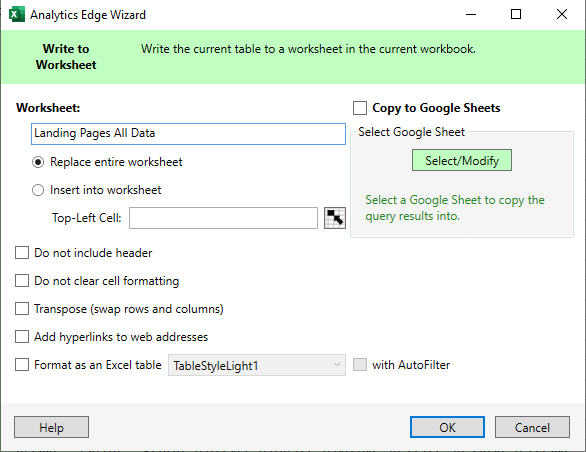
12. Write To Worksheet:
Let’s complete the export by writing the data to a new worksheet. In order to do this, click the File dropdown in the Analytics Edge menu and then select Write to Worksheet. Name your worksheet something like “Landing Pages All Data” and then click OK. Analytics Edge will create a new worksheet containing the full export from GSC. Just click the new worksheet to view all of the data. You’ll notice all of the landing pages were exported with columns showing the difference in clicks, impressions, CTR, and position based on comparing the last 28 days to the previous timeframe. Awesome, right? But we’re not done yet. Our macro will be smarter than that. :)
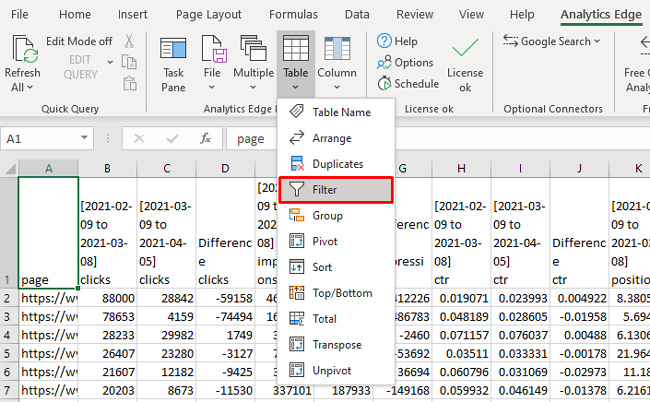
13. Start Filtering Your Data:
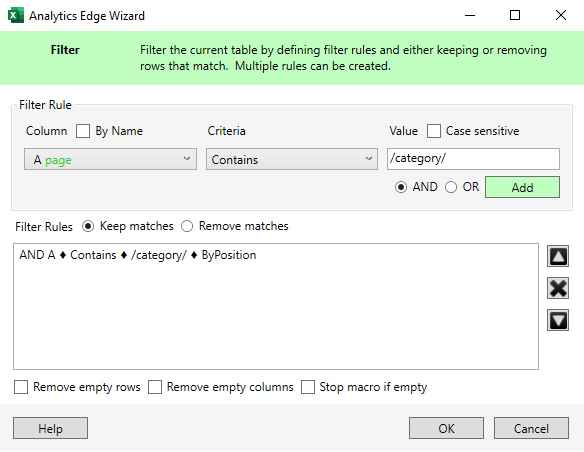
Our goal is to create separate worksheets by page type so you can easily analyze each one separately. To keep things simple, let’s say we wanted to break out category pages (/category/), product pages (/products/), and blog posts (/blog/) so we could analyze them separately. Let’s start with category pages. Click the Table dropdown in the Analytics Edge menu and select “Filter”. This menu will enable you to filter the data by any column in the active table. The active table now is “allpages”, which we set up in step 11. Once you click “Filter in the menu”, you can set the filter rules. The column should say “A page”, which will enable you to filter by the column in our active table titled “page”. For Criteria, you have several helpful options, including regex. Yes, you can use regex here if needed, which is awesome. To filter by category pages which contain /category/ in the url, select “Contains” and then enter /category/ in the Value text box. Then click the Add button. Note, you can combine rules here if you want to create more complex filtering options. Click OK to filter the active table. You will see the results again highlighted in green. We’ll write the filtered data to a worksheet in the next step.
14. Write The Filtered Data To A Worksheet:
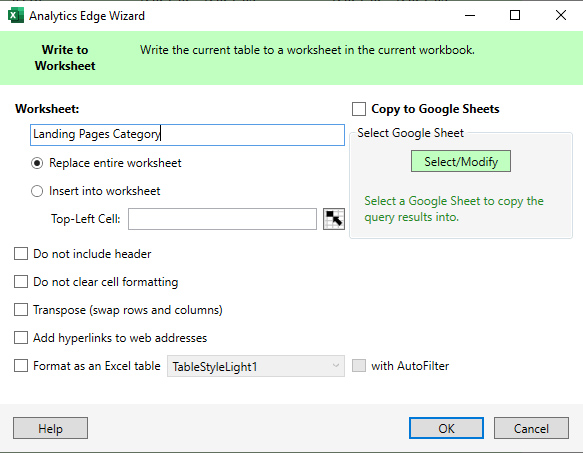
Just like we did before, let’s write the filtered category data to a new worksheet. Click the File dropdown in the Analytics Edge menu and select “Write Worksheet”. Then name the new worksheet “Landing Pages Category” and click OK. A new worksheet will be created with all of the category page data. At this point, you should have two worksheets, one containing all landing page data and another just containing category page data.
15. Switch The Table Back In Order To Filter Again:
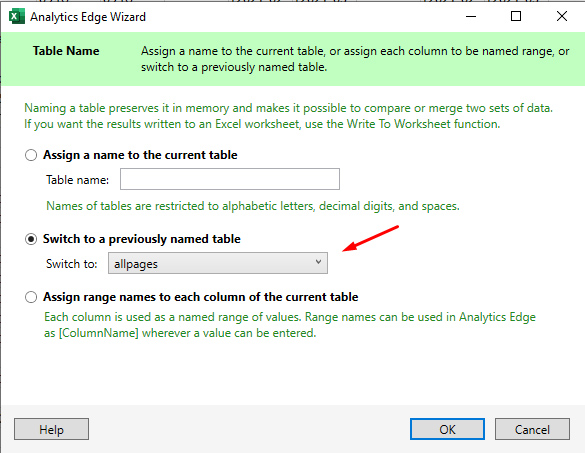
Now we want to filter the full data again for product pages, which contain /product/ in the url. In order to do that, we need to switch the active table back to “allpages”, which contains all of our exported data and not just the filtered category data. If we don’t switch the table name again, then Analytics Edge will use the current active table, which is the category page data. In order to switch the table, click the Table dropdown in the Analytics Edge menu and click Table Name. Click the second radio button to switch to a previously named table and select “allpages”. Now that becomes the active table and we can filter it again.
16. Filter Product Pages:
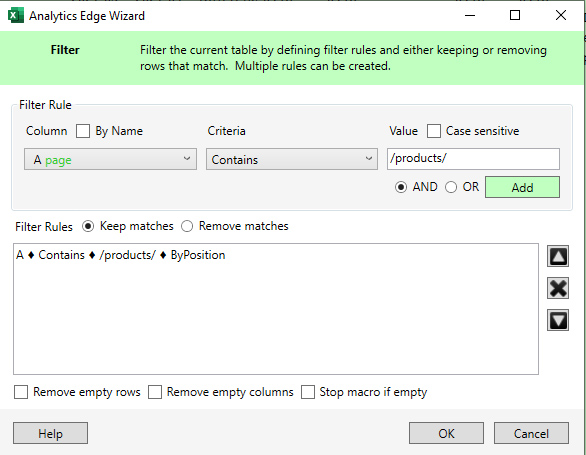
We’ll use the same approach that we did when filtering the category pages, but this time, we’ll filter by urls containing /products/. After switching the table name, select Table again in the Analytics Edge menu and then Filter. Now enter /products/ in the value field for page. Then click OK. The data will now be filtered by any url with /products/ in it.
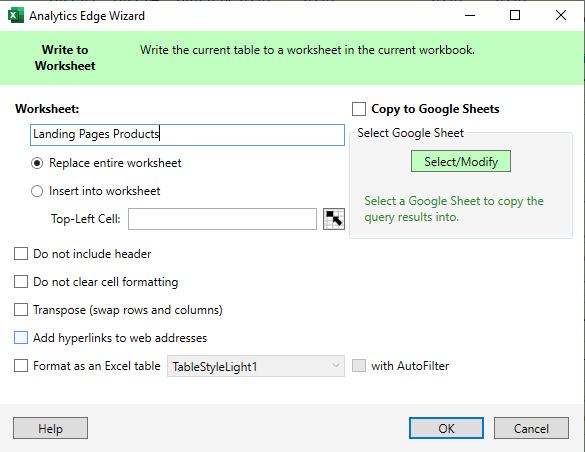
17. Write Filtered Data To Worksheet:
Next, we need to write the product filtered data to a new worksheet. Click the File dropdown in the Analytics Edge menu and select “Write Worksheet”. Name the worksheet “Landing Pages Products” and click OK. You will now have a new worksheet with the filtered data. And now you should have three worksheets containing landing page data (full data, category pages, and product pages).
18. Rinse and Repeat For Blog URLs:
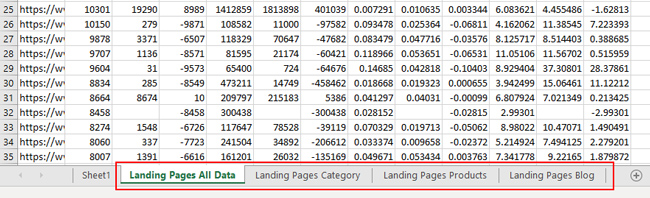
Use the same approach to export all data filtered by blog urls (containing /blog/ in the url). First, switch the table name back to “allpages” (see step 14 for how to do this). Then filter the data by any url containing /blog/, and then write to a new worksheet called “Landing Pages Blog”. When you’re done, you should have four worksheets in total with three that contain filtered data (one for category urls, one for product urls, and one for blog urls). And Analytics Edge already took care of comparing data across timeframes and provided difference columns in the worksheets.
Congratulations! You have exported all of your landing pages from GSC, compared data across timeframes, filtered by page type, and then created specific worksheets containing the filtered data. Oh, and now you have a macro using Analytics Edge that you can reuse whenever you want to accomplish a similar task in the future. Just reopen the spreadsheet, save a new file, edit the macro to change the settings like GSC property, click “Refresh All” in the upper left corner of the Analytics Edge menu, and boom, you’re good to go. Time is valuable and this can save you a lot of it in the future…
Beyond The Delta Report: More Functionality = More Advanced Reporting
As I mentioned earlier, Analytics Edge comes with a ton of functionality built-in. You can create advanced reporting by using the various functions available in Analytics Edge when working with data exported from GSC, Google Analytics, and more. So, if you’re feeling ambitious, here are some other things you can try using Analytics Edge and the GSC Connector:
- Run the same type of report, but for queries instead of landing pages. Then you can analyze drops or surges by query type instead of page type.
- You can segment by search type to analyze drops and surges for Image Search, Video Search, or the News tab.
- You can segment by search feature (like AMP, how-to, FAQs, Q&A, reviews, recipes, etc.) Note, you can follow my tutorial for exporting data by search appearance to learn more about that process.
- And make sure to review all of the functions available in the Analytics Edge menu within the Multiple, Table, and Column dropdowns. For example, you can filter, group, pivot, sort, append, combine, compare, convert, split, and more. Again, Analytics Edge is like a Swiss Army Knife for APIs.
Summary – Automated Delta Reports are Panda Reports on Steroids
It’s always smart to analyze the top landing pages and/or queries when a site sees a big drop or surge in rankings and traffic from Google (due to an algorithm update, site migration, website redesign, etc.) Since the Performance reporting in the GSC UI limits exports by 1K rows, using a tool like Analytics Edge can help you quickly and efficiently export all of your data via the Search Console API.
In addition, Analytics Edge comes with a number of functions for filtering and working with your data to create advanced reports (including comparing data by timeframe). By following this tutorial, you can create a template for quickly exporting data, comparing data across timeframes, filtering by page or query type, and then writing the results to separate worksheets for further analysis. Once you get the hang of Analytics Edge, the sky’s the limit. I think you’ll dig it.
GG