In this tutorial, I’ll show you how to use AI Overview data from Semrush, ahrefs, and Sistrix and combine that with GSC data exported via the Search Console API. The resulting spreadsheet could uncover the true impact to clicks and click-through rate based on AIOs ranking in the SERPs for your queries.

At I/O last week, Google explained that AI Overviews were expanding to 200+ countries and over 40+ languages. They also explained that AI Mode is now available to all users in the United States without needing to opt in via Search Labs. So one thing is for sure, Google is driving forward with both AIOs and AI Mode…
Beyond that, Google’s Liz Reid explained that AI Mode is the future of Search. That’s a big statement and AI Mode can radically impact how users engage with the search results, how much traffic publishers receive from Google, and more.
Regarding traffic from Search, we know that both AI Overviews and AI Mode can negatively impact clicks and click-through rate from the search results. But we also know it’s hard to gain hard data supporting that statement. That’s because Google doesn’t break out AIO data in Google Search Console and AI Mode data isn’t even being tracked yet. That’s coming soon, but it’s not even in GSC at all yet.
AIO data is there in GSC, but it’s mixed in with 10-blue links data. But like I’ve said many times before, good luck trying to analyze that data in GSC. With AIOs mixed in with 10-blue links data (which includes featured snippets), it’s not easy trying decipher the impact of AI Overviews.
So what’s a site owner to do?
Understanding AIO impact. There’s more than one way to uncover the impact.
Based on AI Overviews ranking in the SERPs, site owners could very well be seeing a drop in clicks even when they rank in the same position before the AI Overview joined the party. But it’s hard to prove that without some data showing the before and after performance numbers.
Well, I’m going to show you one way to get a stronger feel for how AIOs are impacting traffic for your site. It’s not perfect but can definitely give you a stronger feel for the impact of AIOs ranking for your queries.
Combining third-party AIO data with GSC data. Here’s what we’ll be doing.
The approach I’ll document below includes exporting all queries via third-party tools that yield AI Overviews when your site ranks in the SERPs for those queries. You don’t necessarily need to rank in the AIO, but just that one is showing up when you are ranking in the SERPs overall. Then we’ll export all query data from GSC via the Search Console API. We’ll do that for two date ranges – one in the past before AIOs were ranking and then a recent date range when AIOs are ranking. Then through vlookup magic, we’ll combine the data to see changes to clicks and click-through rate (if any).
And if you find queries where your site ranks in the same position, or even better across both date ranges, then you can check clicks and click-through rate to determine the impact of the AI Overview ranking in the same SERP. I’ve been doing this for some clients and it’s a good way to get a feel for how AIOs are impacting clicks and click-through rate for those queries.
Note, this process is definitely easier for sites with a lot of search visibility and strong traffic from Google. If your site doesn’t receive a ton of traffic from Google, and doesn’t have a ton of visibility, then this process might not yield the best results for you.
What you’ll need: Tools of the trade.
- Access to third-party visibility tools. I will be pulling AIO data from Semrush, ahrefs, and Sistrix for this tutorial and deduping the data in Excel.
- You will need the ability to export query data via the Search Console API. I have written a number of tutorials using Analytics Edge (which now has a free version and works with both Excel and Google Sheets), but you can use any method or tool you want to export the data. You will need the API if you want more than 1K rows from the GSC UI (which most sites will need).
- Excel or Google Sheets. I’ll be using Excel for this tutorial.
Let’s get started.
How to measure the impact of AIOs ranking for your queries:
1. Export all AIO data across visibility tools.
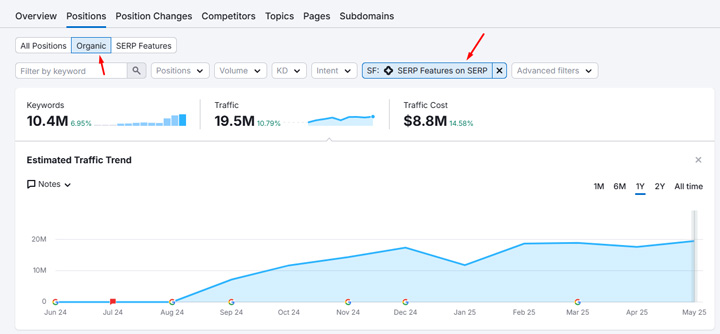
Fire up Semrush and enter the domain you want to analyze. Then click the Positions tab. Under SERP features, select ‘SERP Features on SERP’ and then click ‘AI Overview’. The report will show all queries that the site ranks for when an AI Overview is ranking as well. Note, this does not mean the site ranks in the AI Overview. It simply means the AIO is ranking in the same SERP when your site is ranking as well…
We want to know the impact of an AIO on clicks and CTR overall, so that’s why we are selecting that option. You could always select ‘Domain ranks’ instead of ‘SERP Features on SERP’ to use keyword data when your site does rank in the AIO.
Also, when viewing the Positions report, you can click the ‘Organic’ tab to just view 10-blue links data without other SERP features mixed in like PAA. And you can filter by top 10 rankings if you wanted to get a tighter list of queries that rank well in the SERPs when AIOs rank as well. Once you are ready, export the data from Semrush to Excel or Google Sheets.
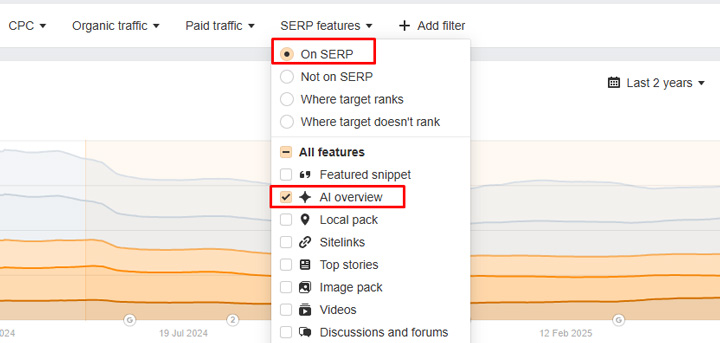
2. Fire up ahrefs and enter the domain you want to analyze.
Click the ‘Organic keywords’ link in the left navigation. Then click ‘Add filter’ at the top of the report and select ‘SERP features’. Click the radio button for ‘On SERP’ and then click the checkbox for ‘AI overview’. The report will now show all queries the site ranks for when an AI Overview ranks as well. Again, this does not mean the site ranks in the AI Overview. It just means an AI Overview is ranking in the SERPs when the site ranks overall for the query. Again, you can always choose ‘Where target ranks’ if you want a list of queries where the site actually ranks in the AIO. Export the data when you are ready.
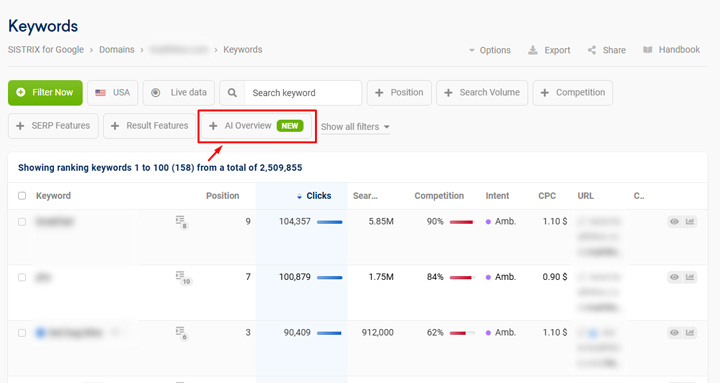
3. Next, fire up Sistrix and enter the domain you want to analyze.
Click the ‘Keywords’ link in the left-side navigation. You’ll notice there is a preset filter for ‘AI Overview’ that you can click. This will yield keywords that the site ranks for when an AI Overview also ranks in the SERP. Export the data.
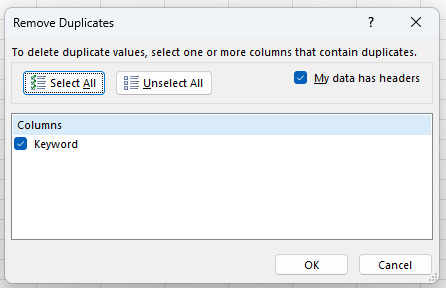
4. Dedupe the data.
Use your spreadsheet application of choice to combine all of the queries in one worksheet named ‘AIOs Deduped’ and then dedupe them. In Excel, you can do this by clicking the Data menu and then ‘Remove Duplicates’ in the ribbon. The resulting list will be your core AIO query list for the site you are analyzing. These are all of the queries that yield AI Overviews in the SERPs when your site is ranking (based on third-party visibility data).
5. Export GSC data via the Search Console API for two different timeframes.
Our goal is to compare the current performance data with AIOs ranking in the SERPs to a previous timeframe when AIOs were not ranking (or at least a time well in the past to see the difference in clicks and CTR). Note, this is not a exact science… I recommend exporting the past month of performance data and comparing to a previous month of data well in the past. AI Overviews rolled out officially in May of 2024 so you can test using a month before that timeframe or even later dates if you believe AIOs were not ranking for those queries then.
If you are using Analytics Edge, then follow my previous tutorials for exporting the data while comparing timeframes. The resulting worksheets will contain all performance data for the site for each timeframe. I would name them ‘Queries’ for the current timeframe and then ‘Queries Prev’ for the previous timeframe. But that’s for all query data and not just the queries where AIOs are ranking. We’ll use vlookup magic to help with that situation… Also, I’ll cover the importance of making sure rankings are stable across both timeframes when you compare the data for individual queries. More on that soon.
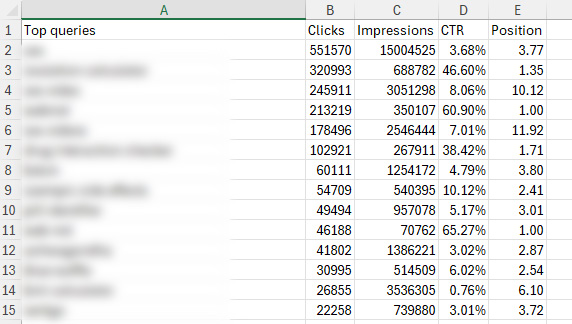
6. Quick status check. What we have now.
We now have three worksheets in the spreadsheet. The first worksheet contains all of the queries that yield AIOs in the SERPs for the site you are analyzing. Then we have two worksheets containing all query data for the site for two different timeframes (the current timeframe and then a timeframe in the past). Now we’ll use some vlookup magic to combine the data, which will give us a view of how AIOs are impacting clicks and click-through rate.
7. Use vlookup to pull in GSC data for queries yielding AI Overviews.
Vlookup is a powerful formula for retrieving data from another table or different worksheet based on a matching cell in the current worksheet. For our purposes, we will use each query in the first worksheet to reference the GSC data across both timeframes. If there’s a match query-wise, then we’ll pull in the performance data for that query from both timeframes we are comparing. We’ll also add columns to show the difference for each metric.
Then the first worksheet will contain all queries yielding AIOs for the site we are analyzing, including performance data from the current timeframe and the timeframe in the past. This will make it easier to analyze the change in clicks and click-through rate for those queries (while also making sure rankings have remained stable for those queries).
8. Add vlookup formulas for clicks, click-through rate, and position.
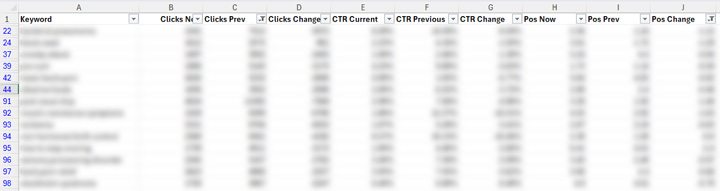
In the worksheet containing all of the deduped AI Overview queries, add new columns for Clicks Current, Clicks Previous, Clicks Change, CTR Current, CTR Previous, CTR Change, and Position Current, Position Previous and Position Change. I’ll provide the first set of vlookup formulas for pulling clicks from the GSC exports for current timeframe and previous timeframe and determining the change in clicks. Then you can easily adjust that formula for the other fields you just created for CTR and position.
First, here is the vlookup formula we will use for the column titled ‘Clicks Current’:
=IFERROR(VLOOKUP(‘AIOs Deduped’!A2, Queries!A:E,2,FALSE), 0)
The vlookup uses the query as the lookup and then checks the worksheet with GSC data from the current timeframe. If there’s a match, it returns the second column in that worksheet, which is the number of clicks. The IFERROR part of the formula checks to see if an error is returned (like if there is no value since the query wasn’t present). If so, it just adds the number 0 to the cell. You can add whatever value you want, but I included 0, which I can easily use for filtering down the line.
9. Apply the formula to the entire column.
Once you hit enter and apply the formula, make sure to hover over the cell and double click the bottom right corner to apply that formula to each cell in the column. You should do this for each of the columns once you apply the formula to the first cell in that column. It’s an easy way to copy that formula to each cell in the column (which can be many rows).
10. Copy the vlookup formula for additional columns.
Next, copy that formula and paste it in the field for Clicks Previous. You’ll need to change the worksheet it references to get the right data. Make sure it pulls from the worksheet titled ‘Queries Prev’ or whatever you named the worksheet containing the GSC data for the previous timeframe. Again, you can click the bottom right corner of that cell to apply the new formula to each row in the column.
11. Now you can use that base formula for click-through rate.
Again, use the core formula for the additional columns. Make sure you are referencing the right worksheets for current versus previous timeframe and then change the field from 2 to 4 to pull the CTR data versus clicks data. CTR is the fourth column so that’s why we are changing 2 to 4. Do this for both the CTR Current and CTR Previous columns.
12. And finally, do this for Position Previous and Position Current columns.
Note, you will need to change the field to 5 which is where position is in the worksheets.
13. Don’t forget to add the difference columns.
Also, make sure to add columns to show the difference in clicks, click-through rate, and position. That can help you easily identify the gaps there when comparing the timeframes. I added columns for Clicks Change, CTR Change, and Position Change. Clicks and Position uses simple subtraction while CTR change should give you the percentage drop. You can subtract the current CTR from the previous CTR and then divide by the previous CTR to come up with the percentage change.
14. Identify the impact.
Before slicing and dicing the data, you might want to copy the worksheet data to a new worksheet and ‘paste as values’. Then you don’t need to deal with the formulas causing problems when filtering the data. Then review the queries looking for a similar position when comparing timeframes. If the position is much different, then that can greatly impact clicks and click-through rate. For example, if a site was negatively or positively impacted by a major algorithm update, then position could be way off from the past. And that change could send clicks and CTR dropping or surging heavily.
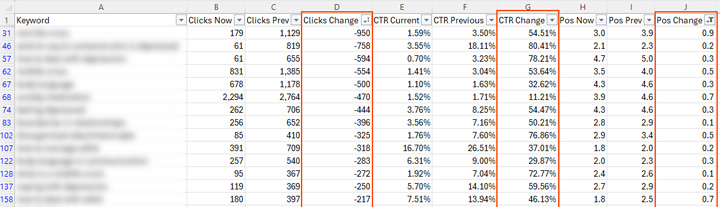
You want to find queries where your site is ranking in about the same position. It’s also worth noting that a drop in clicks can help identify a drop in CTR, but clicks alone could be impacted by other factors. For example, a newsy topic could drive impressions way up, which could have impacted the number of clicks. You can also import impressions by using vlookup which can help while analyzing the data.
Below, you can see a number of queries where position remained stable, but clicks and click-through rate dropped pretty heavily.
Some recommendations and tips for site owners:
- When exporting GSC data, make sure to compare to a timeframe in the past when AIOs were *probably* not ranking. You have 16 months of data so use that. Remember, AIOs officially rolled out in May of 2024.
- Like I explained earlier, this process works much better for sites with a lot of search visibility and traffic from Google. If your site doesn’t have a ton of visibility and traffic from Search, this might not yield great results.
- After running the numbers, make sure position has remained relatively stable. If your site has been impacted by a broad core update, or an unconfirmed update, rankings could have changed radically. And those changes could impact clicks and click-through rate heavily.
- When you identify good examples of queries where AIOs are impacting clicks and CTR, you could use the GSC API to export data by month over the past 12 or 16 months to see the decline over time. You could also graph trending over time, which would be interesting to see.
- Make sure to spot-check the SERPs for queries where you are seeing heavy impact. You never know what you are going to find SERP feature-wise. Or, you may see variations of AI Overviews, new ways the data is being presented, more visuals, and more.
- Don’t just run this analysis once. I recommend running this periodically to see the impact of AIOs on clicks and CTR for the queries your site ranks for (especially as Google pushes more changes with AIOs and AI Mode).
Summary: Combining third-party tool data with GSC data to gain visibility into AIO impact.
Google isn’t making it easy for site owners to analyze the impact of AI Overviews on clicks and click-through rate, but you can leverage the tools available to get a stronger feel for the impact. By combining third-party AIO data with GSC data via the Search Console API, you can see impact over time of AIOs ranking in the search results. I recommend spending some time soon and running the numbers across your sites. Google has been expanding AIOs greatly over time, and the results may surprise you – or not. Feel free to ping me on social media to let me know what you find! Good luck.
GG