
When experiencing a traffic drop due to an algorithm update, redesign, migration, or some other event, it’s important to dig into the drop to understand the queries and landing pages that saw the biggest change. When you do, you can have a strong feel for the pages impacted and the queries leading to those pages (and that can sometimes help you begin to identify the cause of the drop).
When analyzing a traffic drop or surge, there’s nothing better than your own data. For example, digging into Google Search Console and Google Analytics – or whichever analytics package you are using. For example, with GSC’s Search Analytics reporting, you can view clicks, impressions, and average position for queries and landing pages, while also comparing timeframe to see the change. That’s important and can quickly help you gauge the big winners or losers.
In previous posts, I’ve mentioned my tutorial about creating a Panda report, which can help you identify landing pages that saw the biggest change when experiencing a traffic drop. That’s based on Google Analytics data and compares sessions from Google organic after the hit to before the hit (in Excel). It’s a great report that can help surface urls seeing the biggest movement.
But, it doesn’t provide the queries seeing the biggest drop. And that’s exactly what we’re going to tackle today.
The GSC UI Limit and The Power of APIs
If you’re working in GSC a lot, then you know the major limitation with its UI reporting. I’m referring to the one thousand row limit in GSC’s Search Analytics reporting. For larger sites, this is extremely frustrating and can inhibit the amount of data you can work with and export.
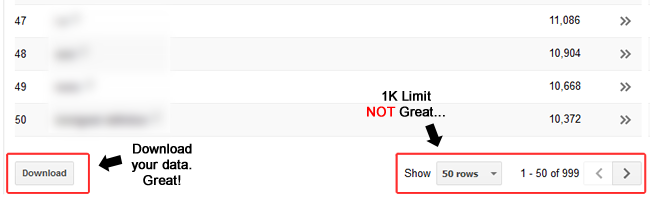
Thankfully, there’s an API that can enable those with developer resources to pull all of the data. That’s great, but what if you don’t have dev resources readily available? How can you get that data??
Analytics Edge to the rescue (again)!
Last year I wrote a post explaining how to export all of your landing pages from GSC via Analytics Edge. It’s an awesome solution that quickly and efficiently pulls GSC data via the API. You can read my post to learn more about that.
For today’s post, I will explain how to go even further by exporting all queries from two different date ranges, and then using the power of Excel to identify the difference in clicks and impressions. Again, after a traffic drop due to an algorithm update, this is invaluable data to have.
Let’s begin.
Step-by-step: How to compare clicks and impressions for queries in Excel:
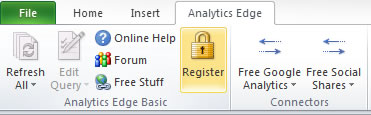
1. Download and install the Analytics Edge free or core add-in. There’s a free trial for the core add-in if you wanted to simply test it out. But the free add-in will work as well (just with less functionality). After installing the add-in, you will register it in Excel.
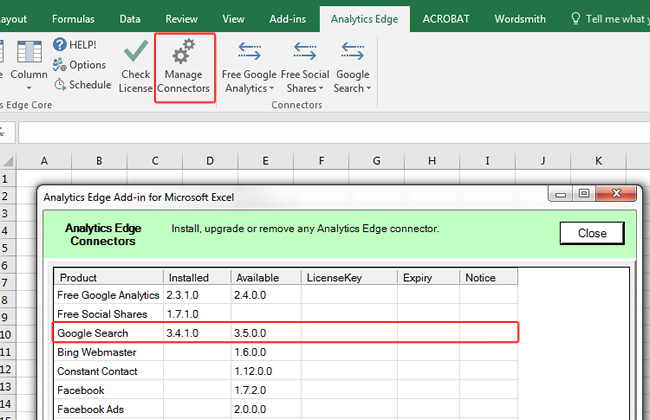
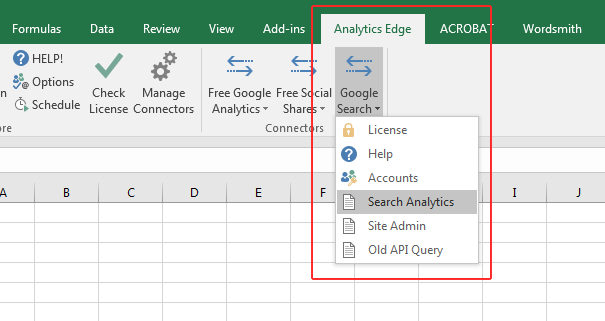
2. Next, install the Search Console connector by clicking the Manage Connectors button in the menu.
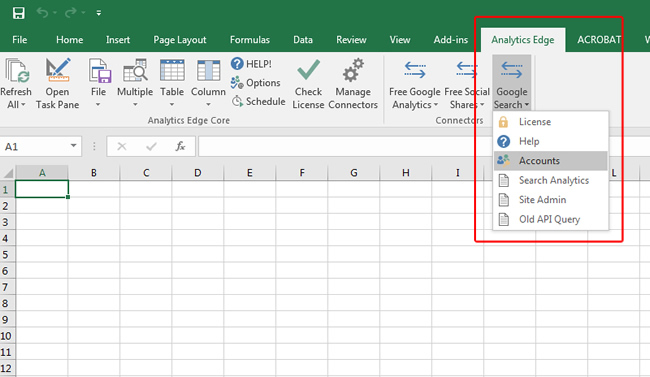
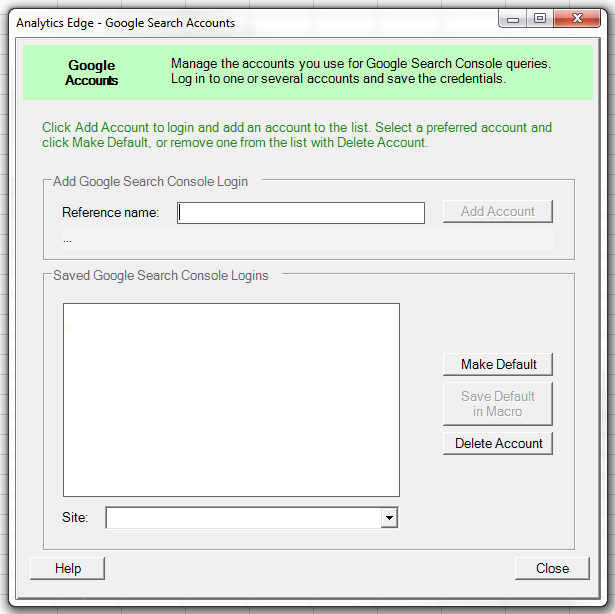
3. Once you install Analytics Edge and the Search Console connector, access the options in the Analytics Edge menu at the top of Excel. Click the Google Search drop-down and select Accounts. This is where you will connect Analytics Edge with the Google account(s) you want to download data from. Go through the process of connecting the Google account you want to work with.
4. Now that you’ve connected a Google account to Analytics Edge, click the Google Search drop-down again and select Search Analytics. This will start the wizard for working with the Search Analytics reporting from GSC. Name the macro whatever you want, and you’ll be taken to the next screen.
5. Now pick an account to work with and a specific website. You should see all of the sites you have access to in the list. Also, select the query dimension, since we want to export all queries from GSC. Next you can select filters and the date range.
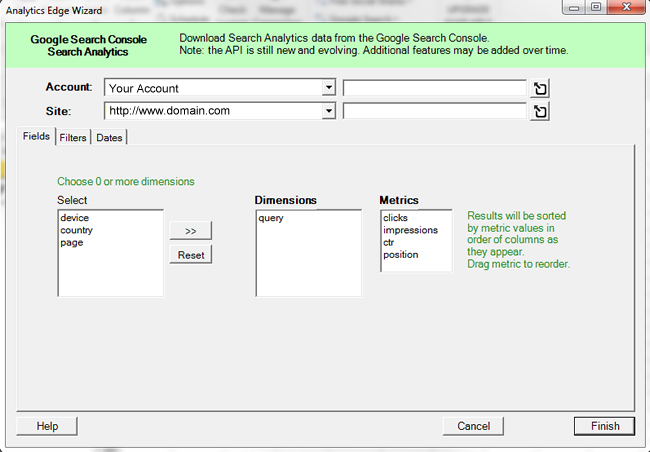
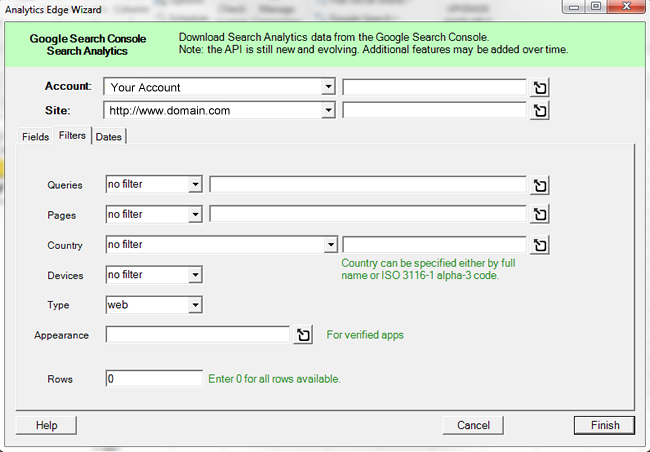
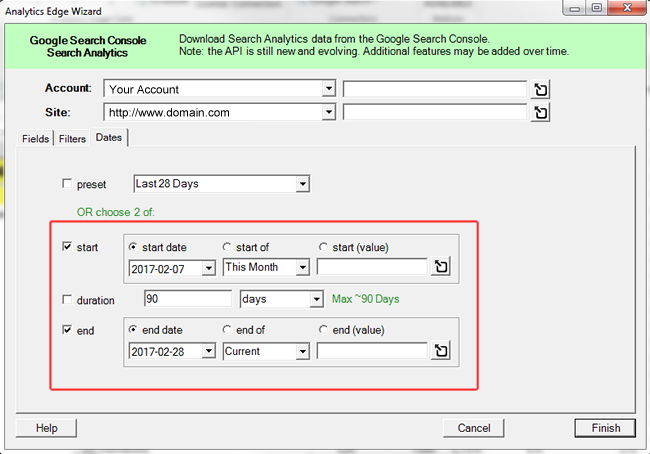
6. There are three tabs in the report interface. The first is labeled Fields, and we just set that up by selecting the query dimension. If you click the Filters tab, you can filter your report by query, page, country, device, type, and search appearance. You can also limit the number of rows you want to export. For our purposes, I would leave them all blank (but you can focus your export by using these filters in the future.)
7. The third tab, labeled Dates, enables you to select the date range for your report. This is extremely important since we want to compare two different time ranges (due to an algorithm update or some other event that caused a traffic change.) For the start date, choose the date the traffic drop began and then choose an appropriate end date. Make sure to give yourself enough days to work with or the comparison might not contain enough data. Then click Finish to start the export.
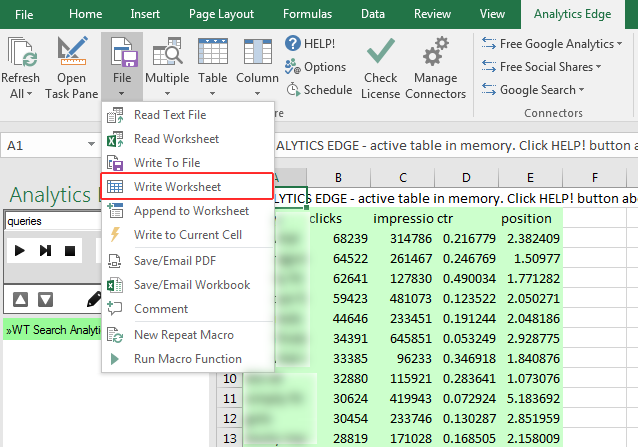
8. Analytics Edge will export your results, but it will only show a sample of the export in the worksheet highlighted in green (in memory). If all looks good with the sample, then you must “write to worksheet” to see all of the data that was exported. In order to do this, click File, and then Write Worksheet. Simply enter a name for your new worksheet like “Current” and click Finish. Boom, check the new worksheet that was created to find all of your queries exported from GSC.
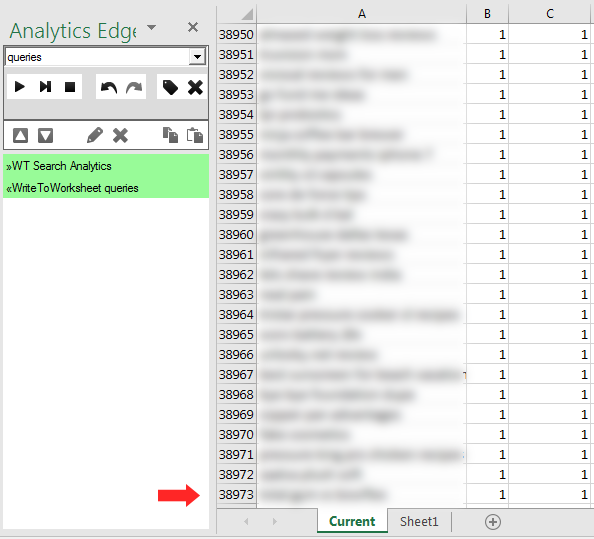
If you followed the instructions above, then you are staring at glorious query data from the timeframe you selected. Not a one-thousand row sample of that data, but the whole enchilada. For example, you can see below that I exported close to 39K queries in just a minute or two. Awesome, right?
9. Repeat step seven again but this time pull data from the previous timeframe. This is the data we are going to compare against. Make sure the amount of days matches what you pulled in the previous step. For example, compare three weeks of data to three weeks of data, or four to four. Don’t compare three weeks to one week or it’s not a true comparison. Also, if your site does not have consistent traffic all week, then make sure your comparison matches the days of the week (versus simply checking the previous X days). You can name this worksheet “Previous” to keep it simple.
Excel Magic Through Vlookup
Once you export the previous timeframe, you will have two worksheets with query data. This is where the magic of Excel comes in handy. We’re going to use vlookup to check the previous timeframe for a query, and if it matches a query in the current timeframe, then we’re going to pull clicks and impressions into our current worksheet. That will enable you to compare metrics for each query prior to the traffic drop, to after the drop.
10. In the worksheet named “Current”, create a new column titled “Clicks Previous”. This is where we will pull click data from the worksheet containing metrics from the previous timeframe. In that field, enter the following formula:
=VLOOKUP(A2,Previous!A:E,2, FALSE)
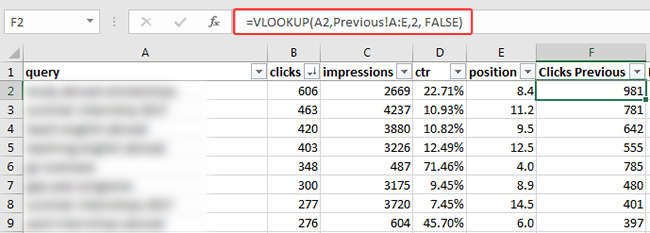
How it works: vlookup will check the query in the current worksheet and then cross reference the query in the second worksheet (which contains data from the previous timeframe). If the query is present, it will pull the clicks data from the second worksheet into the first.
- A2 is the column that contains the query in our “Current” worksheet.
- Previous is the name of our second worksheet containing data from the previous timeframe. Note, if you named the worksheet more than one word, you’ll need to add single quotes around the text.
- A:E is an array that tells Excel which columns to use for the lookup in the second worksheet (Previous). We want to cover all of the columns, which for me contains data in column A through E.
- 2 is the column number (by order) we want to cross reference in the Previous worksheet. Count the columns from left to right and you’ll see “clicks” is the second column over. So that’s why we use 2 as the number in the formula for the fourth argument.
- False is used as the Range_lookup because we want an exact match for the query.
11. I recommend testing the formula on one cell that you know contains a query that’s present in both the Current and Previous worksheets. If the formula worked, then you should see a value show up in the field for Clicks Previous. Quickly check the Previous worksheet to make sure that’s accurate and you’re good to go.
12. Now you need to copy that formula to all rows in the “Clicks Previous” column. The easiest way to do that is to single click the cell containing the new formula and then hover your cursor over the bottom right corner of the cell. Then double-click the small green square. The formula will be copied to all remaining cells in the column. And you should see the previous click count show up in each cell.
13. Repeat the process above for impressions. Create a new column titled “Impressions Previous” and use the same vlookup formula. However, you’ll need to change the column you are using for the lookup. The formula should look like this:
=VLOOKUP(A2,Previous!A:E,3, FALSE)
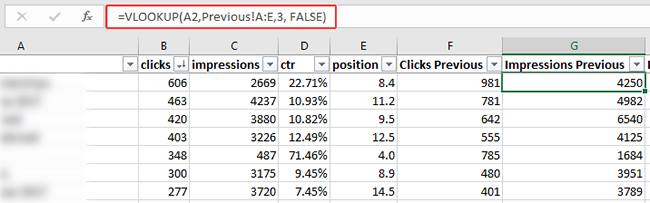
I bolded the 3 since that’s the only difference in the formula. That tells Excel to use the third column for the lookup in our “Previous” worksheet. That third column contains impressions.
14. If all looks good, then copy that formula to the rest of the rows in the “Impressions Previous” column by clicking the small green square in the bottom right corner of the cell again.
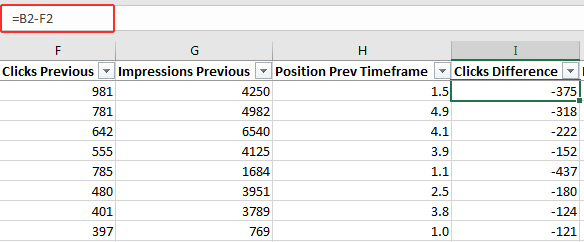
15. Now you will create additional columns that simply show the difference in clicks and impressions between the previous and current timeframe. Create new columns titled “Clicks Difference” and “Impressions Difference”. Then enter the following formula which will subtract the previous timeframe metric from the current timeframe:
=B2-F2
Note, B2 is the column containing clicks from the current timeframe and F2 contains clicks from the previous timeframe.
Then repeat for impressions, but this time using the following formula:
=C2-G2
Note, C2 contains impressions from the current timeframe while G2 contains impressions from the previous timeframe.
To copy those formulas to the rest of the rows in each column, use the trick I explained earlier to single click the cell you want to copy and then hover your cursor over the bottom right corner. Then double click the small green square.
At this point, you should have a worksheet that provides current metrics from GSC along with metrics from a previous timeframe. And you should also see the difference in clicks and impressions by query. This data is invaluable for digging into queries that dropped based on an algorithm update, redesign, migration, or other event that caused a traffic drop. Awesome, right?
Some Final Tips:
- You can use conditional formatting to highlight cells that dropped by a certain amount. That can help you and your team quickly identify queries that saw the most impact.
- You can add a column for “Position Change” and use average position in your vlookup. Then you can see the number of positions each query dropped or gained.
- You can follow my tutorial about using Analytics Edge to export all landing pages to dig into the pages that dropped as well. Then you can run this report again and use landing pages versus queries. Then you can dig into the specific urls that dropped the most.
Summary – Use the API, Love the API
Google Search Console (GSC) is a killer tool that every SEO should use, but the one thousand row limit can be maddening for site owners of larger websites. Using the API via a tool like Analytics Edge can enable site owners to export well beyond the one thousand row limit. And then you can use the power of Excel to analyze the data. It’s a great combination that I’ve found incredibly valuable while researching traffic drops due to algorithm updates (or other events). I recommend trying this out today. I have a feeling you are going to dig it.
Nice tutorial Glenn, didn’t know this was available for Excel! Since most of our agency work is done via G Suite, I had to code something similar for Google Sheets that interacts with the Search Analytics API: https://moz.com/blog/how-to-use-search-analytics-in-google-sheets-for-better-seo-insights
Just curious, can the Excel add-on handle property sets well?
Thanks Mihai! I”m glad you were able to learn about AE via my post. It’s a great solution that I’ve been using for a long time. And yes, it works with Property Sets. The name of the property set is cryptic via the API, but you can use them. I hope that helps.
From within GSC/GWT place your pointer over the Property Set, you’ll see a URL link with the prefix “sc-set:” this will appear in the “Site:” list in the Wizard dialog box. Hope this helps!
Although VLOOKUP set up is a nightmare to me, but a very useful post Glenn.
Thanks :)
LOL, thanks Praveen! It actually makes sense when you break it down, but I totally get what you’re saying. :) Glad you enjoyed my tutorial.
Yea I know, that’s why I am still figuring out an easy way to do it. :)
Super awesome. Thanks Glenn!
I was looking for this, great Glenn, not just a post, a full tutorial on the topic. ;)