
Google has been releasing new features in the search results more and more recently that can have a big impact on SERP treatment, click-through rate, and potentially traffic. Three of those features are part of Google’s “best answer carousels” and include Q&A, How-to, and FAQ snippets. Q&A has been live for a while already, while How-to and FAQ were just rolled out during Google I/O. Note, you can read my post about How-to snippets to learn more about how they work, what they look like, etc.
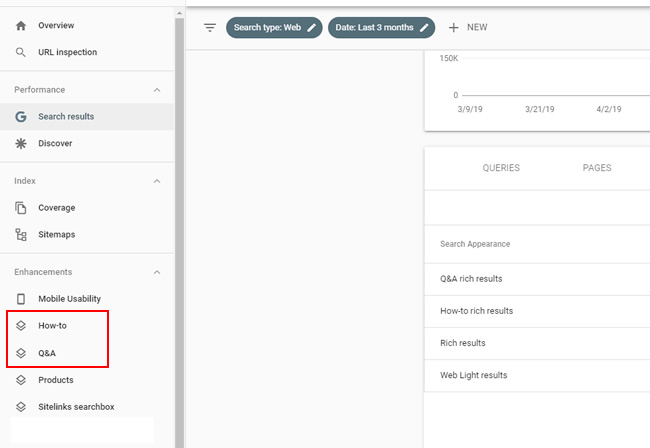
I have several clients heavily using these formats, so I’ve been analyzing their performance via Google Search Console (GSC) recently — via the new enhancement reports and the Performance reporting. For example, once you start marking up pages using Q&A, How-to, or FAQ markup, you will see new reports show up under the Enhancements tab in GSC. And those reports can be very helpful for understanding errors, warnings, and valid pages.
How To Analyze Performance In GSC By Search Feature:
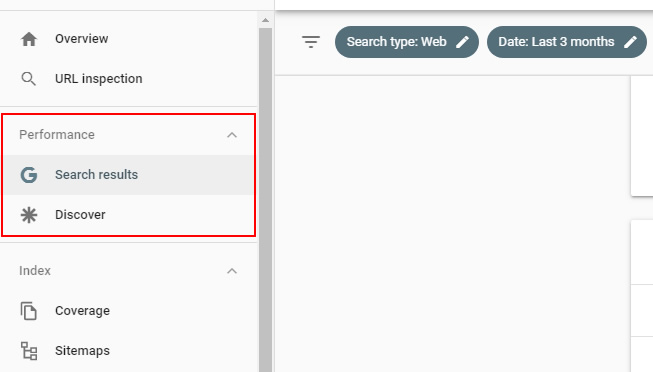
From a clicks, impressions, and CTR standpoint, you can check the Performance report to view your data over time. Note, if you have Discover data, then there will be two reports under Performance. The first will say Search Results and the second will be titled Discover.
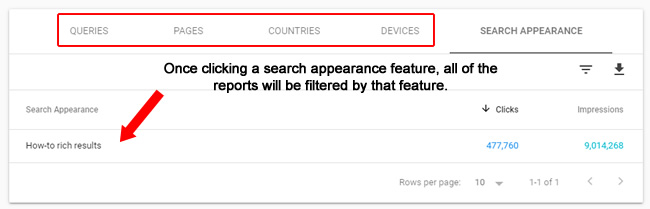
Once in the Performance report (or the “Performance in search results” report), the Search Appearance tab enables you to drill into data by specific feature. You can see that the site from earlier has both How-to and Q&A results. If you click each category title, then you will be isolating that search feature in the reporting (i.e. the reports will be filtered by that search feature). So, you can view queries, landing pages, etc. for just Q&A or How-to results. This applies to AMP as well.
The 1K Row Limit In GSC. The Bane Of A Site Owner’s Existence
Filtering the reporting by search feature is powerful, but remember, GSC only provides one thousand results by report in the web UI and you can only export those one thousand results. For smaller sites, that should be fine. But for larger-scale sites with thousands, tens of thousands, or more listings, then the reporting can be extremely limiting.
For situations like that, what’s a site owner to do??
Analytics Edge To The Rescue Again. Exporting Beyond 1K Results By Search Feature:
I’ve written several posts about Analytics Edge before, and it’s still my go-to tool for exporting data in bulk from GSC. It’s a powerful Excel plugin that enables you to quickly and efficiently export bulk data from GSC, GA, and more.
Below, I’ll take you step-by-step through exporting your data by Search Appearance from GSC. If you’re a large-scale site that’s using Q&A, How-to, FAQ, and even AMP, then you’re going to dig this. Let’s jump in.
How to use Analytics Edge to bulk export data by Search Appearance:
Note, this will be a two-phase approach. The first run will enable us to pull all Search Appearance codes for the specific property in GSC. Then the second run will enable us to pull all data by that Search Appearance code.
Phase One:
- Download and install the Analytics Edge free or core add-in. There’s a free trial for the core add-in if you wanted to simply test it out. But the free add-in will work as well (just with less functionality). After installing the add-in, you should register it in Excel.
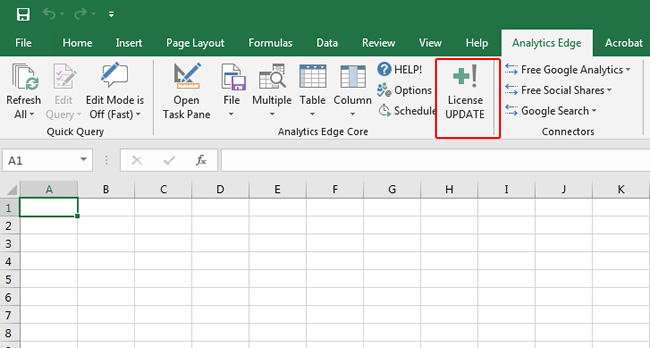
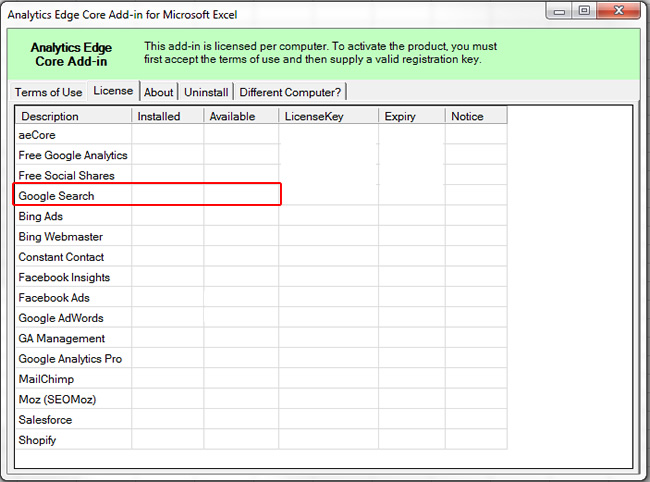
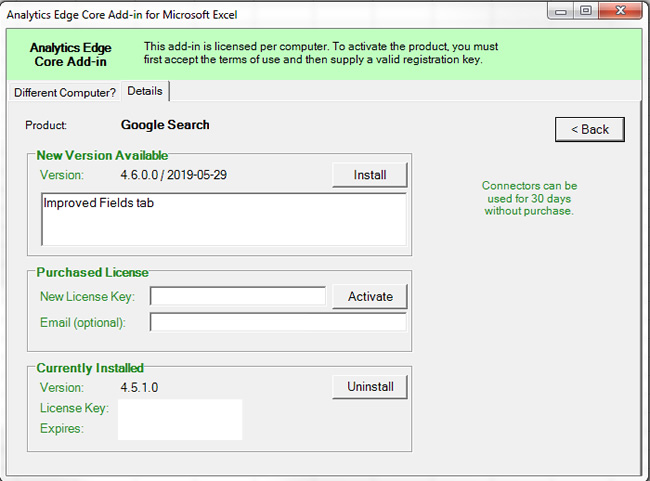
- Next, install the Search Console connector by clicking the License/Update button in the menu. You can watch this short video to learn how to install connectors. You can click the Google Search row to pull up the connector details (where you can choose to install that connector).


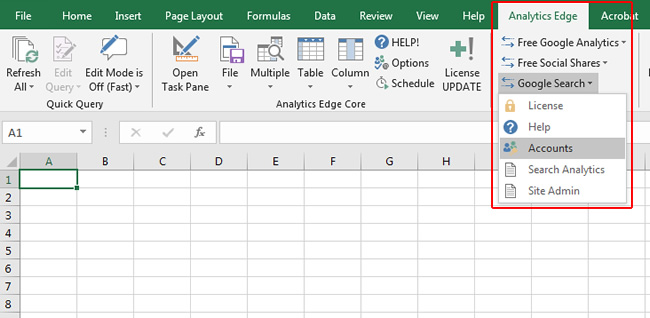
- Once you install Analytics Edge and the Search Console connector, access the options in the Analytics Edge menu at the top of Excel. Click the Google Search drop-down and select Accounts. This is where you will connect Analytics Edge with the Google account(s) you want to download data from. Go through the process of connecting the Google account you want to work with. You can also make one account the default, which will save you time in the future.


- Once you connect your account, click Google Search in the Connectors section, and then Search Analytics.
- Name your Macro and click OK.
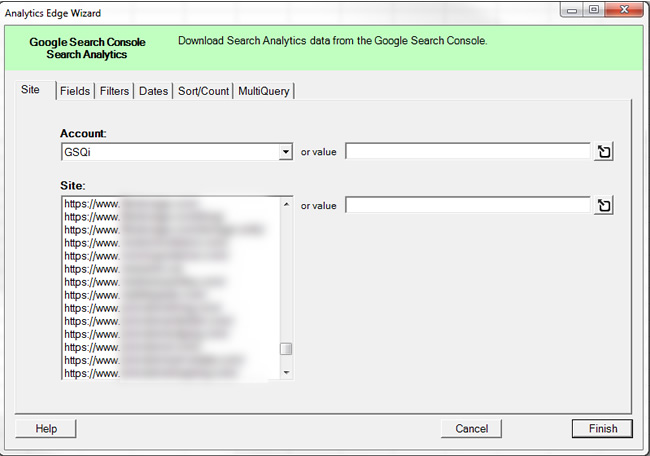
- Select an account and then a property from GSC.
- We will use a two-phase approach for exporting data by Search Appearance. First, we are going to view the various options we have under Search Appearance (there will be codes that show up representing each SERP feature available to a property). We will use these codes during our second run to pull all data for each specific search feature (like How-to, Q&A, FAQ, AMP, etc.)
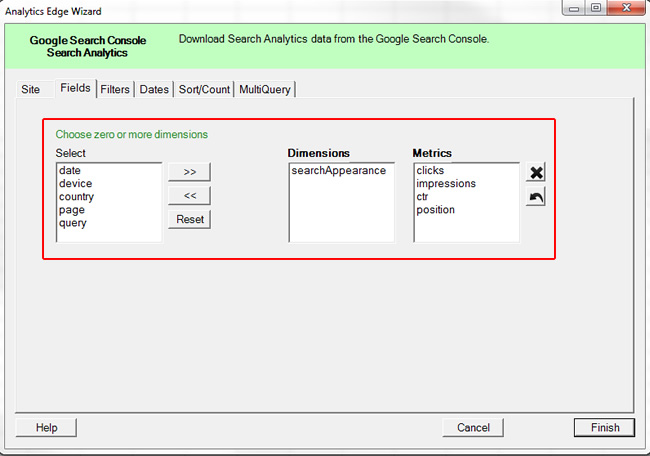
- Under the Fields tab, select searchAppearance, which will move that option to the Dimensions window.
- For the Dates tab, you can leave “Last 3 Months” active (which is the default).
- Leave everything else the same and click “Finish”.
- Analytics Edge will return all of the possible Search Appearance codes for the site for the time period you selected. For example, in the screenshot below, there were impressions and/or clicks for AMP (article and non-rich results), Q&A, How-To, and others for the property I selected.

- Copy the codes from the searchAppearance column to a text file so you can reference them in phase two of our tutorial. You will need these codes to export all data by that specific search feature.

Phase Two:
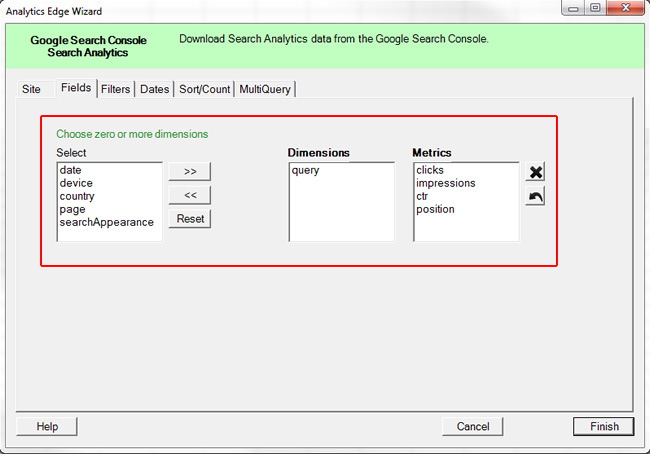
- Now we are going to use the searchAppearance codes to export data in bulk for a specific search feature. Click Google Search again, and then Search Analytics. Choose an account and a property again. When you get to the options screen, select the dimensions you want to export (in the Fields tab). For this example, let’s select query (to see the queries yielding How-to snippets in the search results).

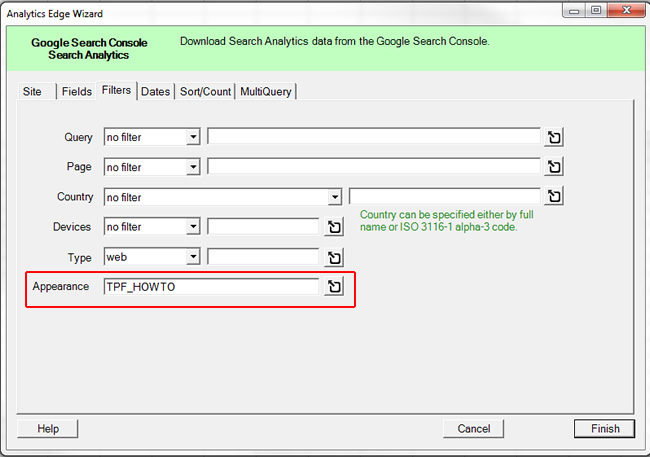
- Next, go to the Filters tab and find the Appearance field. In that field, enter TPF_HOWTO, which is the code for How-to snippets. If you want to export data for another search feature, just use that code instead.

- Next, select the dates you want to run the report for. For this example, I’ll select “Last 28 days”.
- Then under Sort/Count, select clicks and then descending in the “sort by” dropdown. This will sort the table by the queries with the most clicks over the past 28 days (that yield How-to snippets).
- Then click “Finish”.
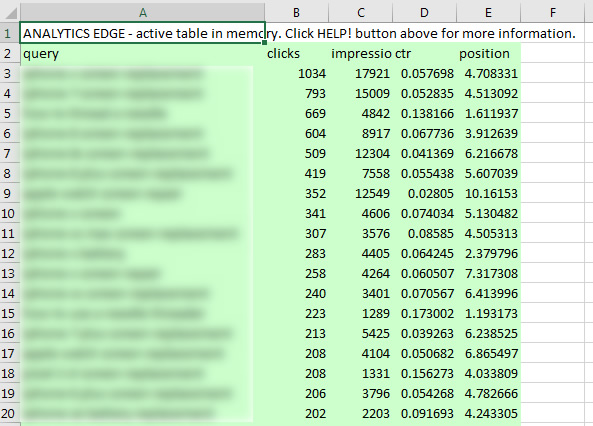
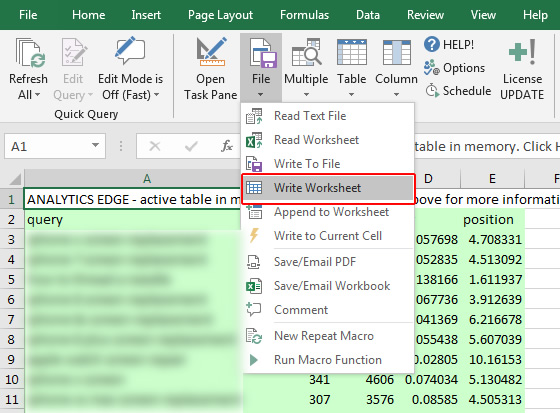
- Analytics Edge will run and export all of the queries yielding How-to snippets. This can take a bit of time (from a few seconds to a minute or longer) depending on how large the site is and how much data needs to be exported. Note, just a sample of data will be presented in memory in the worksheet (and highlighted in green). You need to “write to worksheet” to show all of the data.

- To do that click File and then “Write Worksheet”. Name the worksheet and click OK. You will now see a new worksheet containing all of your data. For this example, I see 26K+ queries that have yielded How-to snippets over the past 28 days. Yep, over 26K!

- Congratulations! You just exported search feature data from GSC and blew by the 1K row limit!
Tracking, Using, and Learning From The Data:
Once you export your data by Search Appearance in bulk, you will have full access to all of the queries yielding Q&A, How-To, FAQ snippets, AMP, and more. You can track their position, double check the SERPs to understand the SERP treatment for each feature, understand the click-through rate for each snippet, and more.
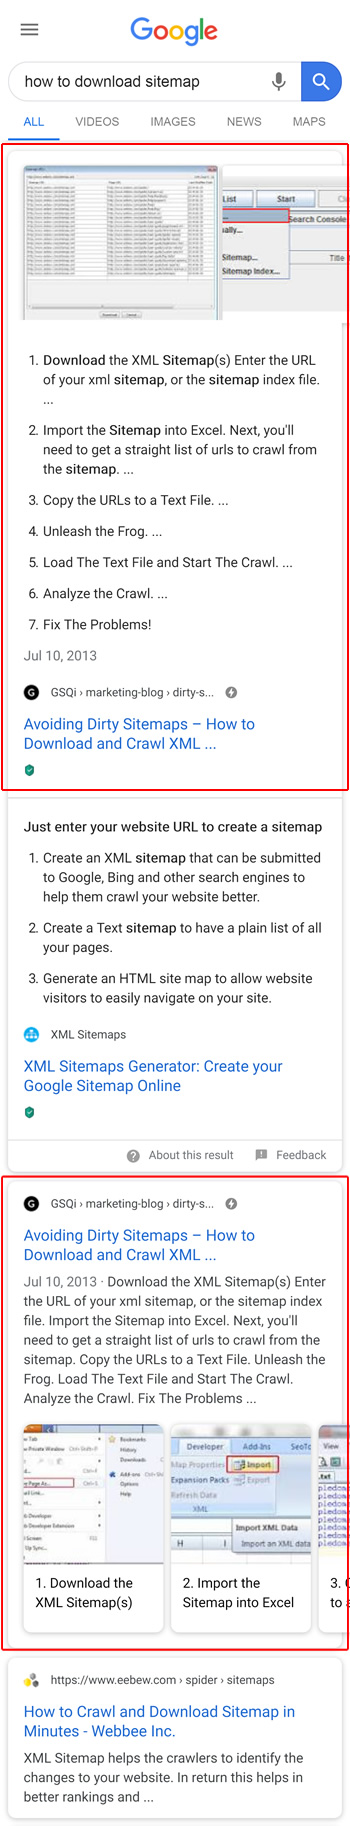
For example, you might find that “list treatment” for How-tos is yielding a higher click through rate than the carousel treatment. Or you might find that a certain How-to has a featured snippet in addition to the How-to snippet (a How-to/featured snippet combo). And then you can check metrics based on that situation. You get the picture!
You can see an example of a How-to/featured snippet combo below:
My recommendation is to export data by each search feature for the past 28 days and start digging into the data. Then regularly export the data (like weekly) to understand the changes over time. E.g. changes in metrics, SERP treatment, and more.
Summary – Free Yourself From the 1K Row Limit In GSC By Exporting SERP Feature Data Via Analytics Edge
Now that more and more features are hitting the SERPs, using a tool like Analytics Edge can help you export all of your data, versus just one thousand rows per report. And when you export all of the queries and landing pages per SERP feature, you can glean more insights from the data. If you are using AMP, How-to, Q&A, or FAQs, then I highly recommend exporting your data via a tool like Analytics Edge. I think you’ll dig it.
GG