
In previous posts about Panda analysis, I’ve mentioned the importance of understanding the content that users are visiting from Google organic. Since Google is measuring user engagement, hunting down those top landing pages can often reveal serious content quality problems.
In addition, I’ve written about understanding the devices being used to access your site from the search results. For example, what’s the breakdown of users by desktop, mobile, and tablets from Google organic? If 50% of your visits are from smartphones, then you absolutely need to analyze your site through that lens. If not, you can miss important problems that users are experiencing while visiting your website. And if left unfixed, those problems can lead to a boatload of horrible engagement signals being sent to Google. And that can lead to serious Panda problems.
Panda Help Via Segments in Google Analytics
So, if you want to analyze your content by desktop, mobile, and tablet users through a Panda lens, what’s the best way to achieve that? Well, there’s an incredibly powerful feature in Google Analytics that I find many webmasters simply don’t use. It’s called segmentation and enables you slice and dice your traffic based on a number of dimensions or metrics.
Segments are non-destructive, meaning that you can apply them to your data and not affect the source of the data. Yes, that means you can’t screw up your reporting. :) In addition, you can apply new segments to previous traffic (they are backwards compatible). So you can build a new segment today and apply it to traffic from six months ago, or longer.
For our purposes today, I’m going to walk you through how to quickly build three new segments. The segments will isolate Google organic traffic from desktop users, mobile users, and tablet users. Then I’ll explain how to use the new segments while analyzing Panda hits.
How To Create Segments in Google Analytics
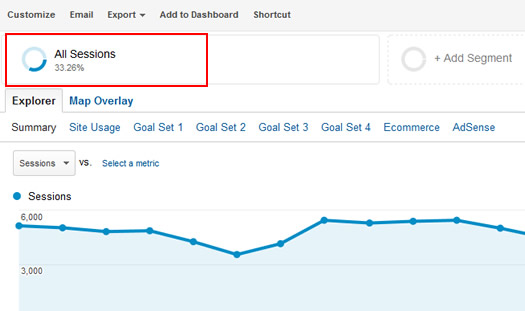
When you fire up Google Analytics, the “All Sessions” segment is automatically applied to your reporting. So yes, you’ve already been using segments without even knowing it. If you click the “All Sessions” segment, you’ll see a list of additional segments you can choose.
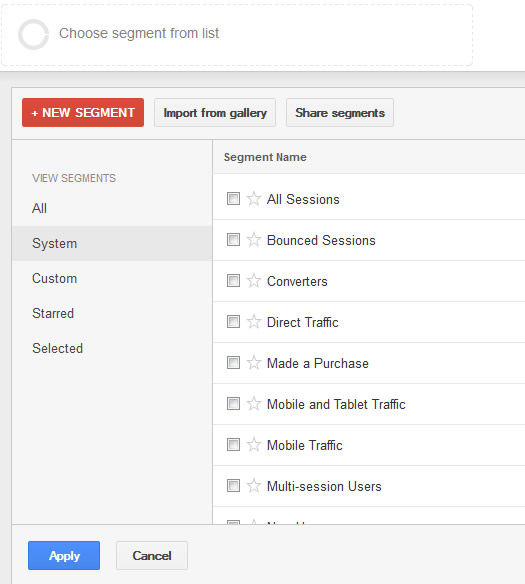
You might be surprised to see a number of segments have been built for you already. They are located in the “System” category (accessed via the left side links). For example, “Direct Traffic”, “AdWords”, “Organic Traffic”, and more.
We are going to build custom segments by copying three system segments and then adding more dimensions. We’ll start by creating a custom segment for mobile traffic from Google organic.
1. Access the system segments by clicking “All Sessions” and then clicking the link labeled “System” (located on the left side of the UI).
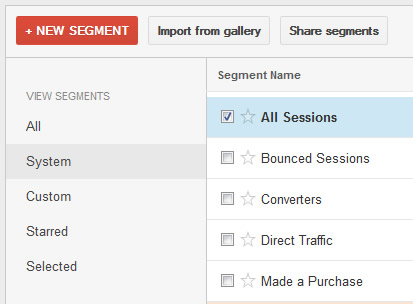
2. Scroll down and find the “Mobile Traffic” segment. To the far right, click the “Actions” dropdown. Then choose “Copy” from the list.

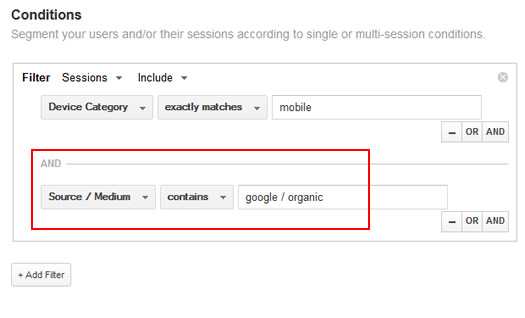
3. The segment already has “Device Category”, “exactly matches”, and “mobile” as the condition. We are going to add one more condition to the list, which is Google organic traffic. Click the “And” button on the far right. Then choose “Acquisition” and the “Source/Medium” from the dimensions list. Then choose “exactly matches” and select “google/organic” from the list. Note, autocomplete will list the top sources of traffic once you place your cursor in the text box.
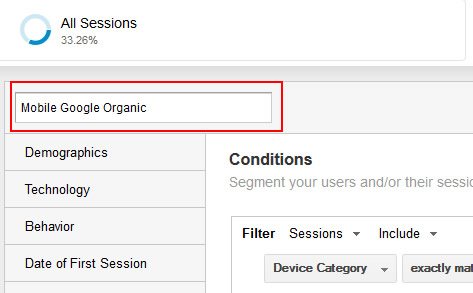
4. Name your segment “Mobile Google Organic” by using the text box labeled “Segment Name” at the top of the window. It’s easy to miss.
5. Then click “Save” at the bottom of the create segment window.
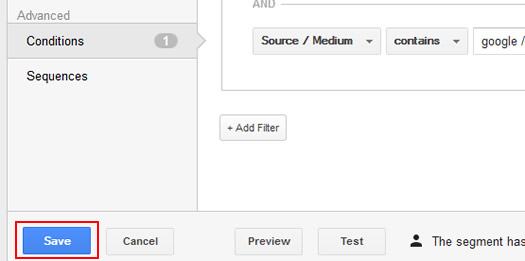
Congratulations! You just created a custom segment.
Create The Tablet Traffic Segment
Now repeat the process listed above to create a custom segment for tablet traffic from Google organic. You will begin with the system segment for “Tablet Traffic” and then copy it. Then you will add a condition for Google organic as the source and medium.
Desktop Traffic (Not a default system segment.)
I held off on explaining the “Desktop Traffic” segment, since there’s an additional step in creating one. For whatever reason, there’s not a system segment for isolating desktop traffic. So, you need to create this segment differently. Don’t worry, it’s still easy to do.
We’ll start with the “Mobile Traffic” segment in the “System” list, copy it, and then refine the condition.
1. Click “All Sessions” and the find “Mobile Traffic” in the “System” list. Click “Actions” to the far right and then click “Copy”.

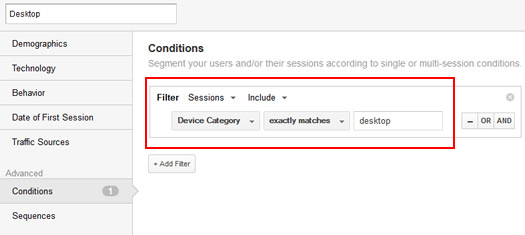
2. The current condition is set for “Device Category” exactly matching “mobile”. We’ll simply change mobile to “desktop”. Delete “mobile” and start typing “desktop”. Then just select the word “desktop” as it shows up.
3. Since we want Desktop traffic from Google Organic, we need to add another condition. You can do this by clicking “And” to the far right, selecting “Acquisition”, and then “Source/Medium” from the dropdown. Then select “exactly matches” and enter “Google/Organic” in the text box. Remember, autocomplete will list the top sources of traffic as you start to type.
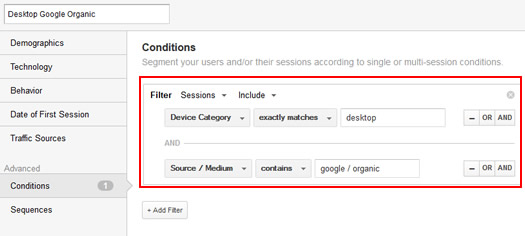
4. Name your segment “Desktop Google Organic” and then click “Save” at the bottom of the segment window to save your new custom segment.
Quickly Check Your Segments
OK, at this point you should have three new segments for Google organic traffic from desktop, mobile, and tablets. To ensure you have these segments available, click “All Sessions” at the top of your reporting, and click the “Custom” link on the left. Scroll down and make sure you have all three new segments. Remember, you named them “Desktop Google Organic”, “Mobile Google Organic”, and “Tablet Google Organic”.
If you have them, then you’re good to go. If you don’t, read through the instructions again and create all three segments.
Run Panda Reports by Segment
In the past, I’ve explained the importance of running a Panda report in Google Analytics for identifying problematic content. A Panda report isolates landing pages from Google organic that have dropped substantially after a Panda hit. Well, now that you have segments for desktop, mobile, and tablet traffic from Google organic, you can run Panda reports by segment.
For example, click “All Sessions” at the top of your reporting and select “Mobile Google Organic” from the “All” or “Custom” categories. Then visit your “Landing Pages” report under “Behavior” and “Site Content” in the left side menu in GA. Since you have a specific segment active in Google Analytics, the reporting you see will be directly tied to that segment (and filter out any other traffic).
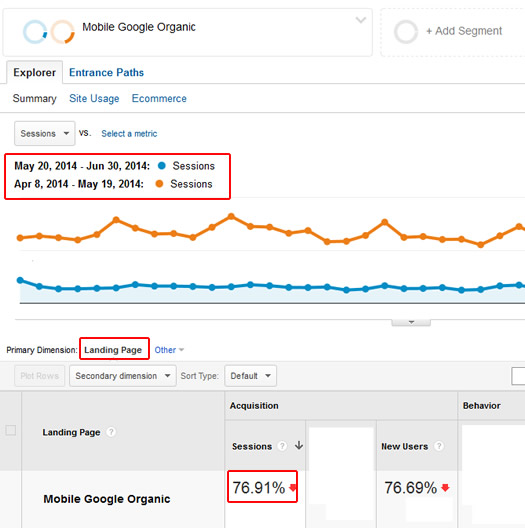
Then follow the directions in my previous post to run and export the Panda report. You’ll end up with an Excel spreadsheet highlighting top landing pages from mobile devices that dropped significantly after the Panda hit. Then you can dig deeper to better understand the content quality (or engagement) problems impacting those pages.
Combine with Adjusted Bounce Rate (ABR)
User engagement matters for Panda. I’ve documented that point many times in my previous posts about Panda analysis, remediation, and recovery. The more poor engagement signals you send Google, the more bamboo you are building up. And it’s only a matter of time before Panda comes knocking.
So, when analyzing user engagement, many people jump to the almighty Bounce Rate metric to see what’s going on. But here’s the problem. Standard Bounce Rate is flawed. Someone could spend five minutes reading a webpage on your site, leave, and it’s considered a bounce. But that’s not how Google sees it. That would be considered a “long click” to Google and would be absolutely fine.
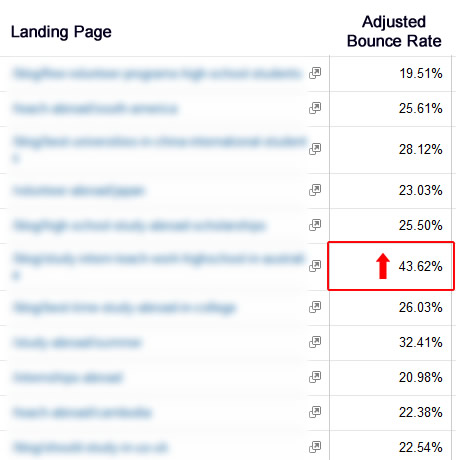
And this is where Adjusted Bounce Rate shines. If you aren’t familiar with ABR, then read my post about it (including how to implement it). Basically, Adjusted Bounce Rate takes time on page into account and can give you a much stronger view of actual bounce rate. Once you implement ABR, you can check bounce rates for each of the segments you created earlier (and by landing page). Then you can find high ABR pages by segment (desktop, mobile, and tablet traffic).
Check Devices By Segment (Smartphones and Tablets)
In addition to running a Panda report, you can also check the top devices being used by people searching Google and visiting your website. Then you can analyze that data to see if there are specific problems per device. And if it’s a device that’s heavily used by people visiting your site from Google organic, then you could uncover serious problems that might lie undetected by typical audits.
GA’s mobile reporting is great, but the default reporting is not by traffic source. But using your new segments, you could identify top devices by mobile and tablet traffic from Google organic. And that’s exactly what you need to see when analyzing Panda hits.
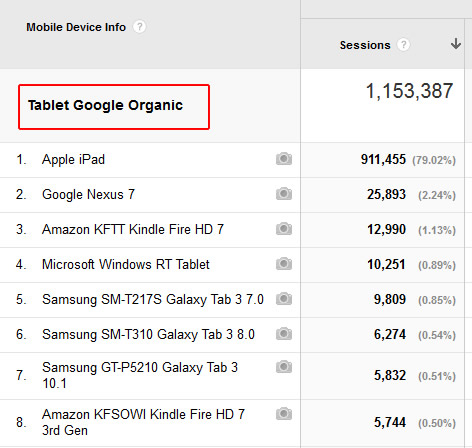
For example, imagine you saw very high bounce rates (or adjusted bounce rates) for ipad users visiting from Google organic. Or maybe your mobile segment reveals very low engagement from Galaxy S5 users. You could then test your site via those specific devices to uncover rendering problems, usability problems, etc.
Summary – Isolate SEO Problems Via Google Analytics Segments
After reading this post, I hope you are ready to jump into Google Analytics to create segments for desktop, mobile, and tablet traffic from Google organic. Once you do, you can analyze all of your reporting through the lens of each segment. And that can enable you to identify potential problems impacting your site from a Panda standpoint. I recommend setting up those segments today and digging into your reporting. You might just find some amazing nuggets of information. Good luck.
GG
