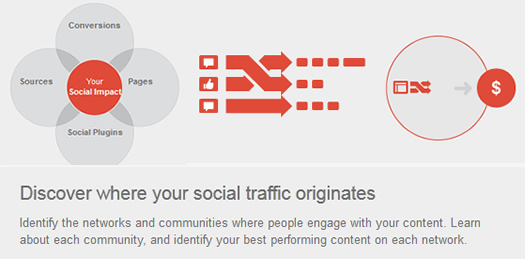
In March of this year, Google Analytics released a set of new reports for measuring the effectiveness of traffic from social networks. It was a great addition and provides some valuable information about how social is affecting your business. For example, you can view social referrers, content that received traffic from social networks, view conversations across certain social networks, view conversion data (including last click and assisted attribution), how social visitors flow through your site, and more.
One question I keep getting from business owners is how to easily analyze a piece of content they are tracking? For example, let’s say a certain blog post went live recently, was heavily shared across social networks, and ended up driving a lot of traffic. What if you want to isolate that page and view data via GA’s social reports? Well, you can absolutely do that, and I’m going to walk you through some of the core insights you can glean from the reporting. Let’s get started.
Isolating a Blog Post or Piece of Content
For this tutorial, I’m going to use a recent post of mine, which ended up being popular within the search marketing industry. Last month, I attended the Google Agency Summit and found out that the old Google Wonder Wheel’s engine actually drives the Contextual Targeting Tool. The Wonder Wheel was a great tool for finding related searches, based on actual Google data, and many in my industry loved using it. Needless to say, search marketers were thrilled to find out the functionality can still be found in the Contextual Targeting Tool. The post ended up getting shared quite a bit on Twitter, Facebook, and Google+. Let’s take a look at the social reporting for this post.
You can isolate a page in two ways via social reporting in Google Analytics. The first way is from the overview page, and the second way is from the Pages report. Let’s jump to the Pages report, which will list your top content receiving traffic from social networks. You can access this report by clicking “Traffic Sources”, “Social”, and then “Pages”.
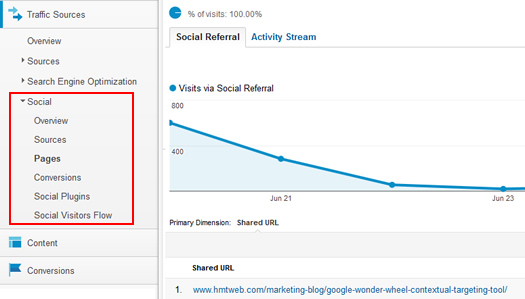
At this point, you will see a list of pages from your site, along with key metrics like visits, pageviews, time on site, data hub activities, etc. I’ll cover what data hub partners are in a second. For now, find the page you want to analyze and click the URL. For me, I’m going to click the URL for my Google Wonder Wheel post, which had 1040 visits from social networks from June 20th through June 30th.
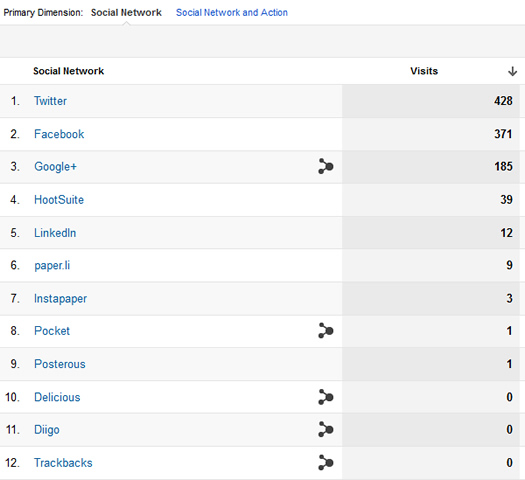
After clicking the URL, the Social Referral tab is the default view. Here, you can view the social networks driving the most traffic to the post, along with viewing trending for all traffic versus trending for social traffic. In addition, the primary dimension in the report is “Social Network”, which as I mentioned above, will display a list of social networks driving the most traffic to this specific post. For me, Twitter, Facebook, and Google+ drove the most traffic to this post over the 10 day period.
Social Actions and Data Hub Partners
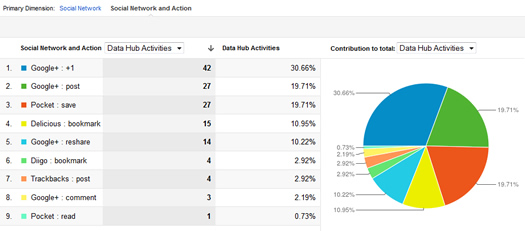
If you click the “Social Network and Action” dimension, you will see Data Hub Activities for the post. Data Hub partners are social networks that have chosen to share additional information with Google so users of Google Analytics can view that data within Google Analytics reporting. The activity stream from data hub partners can provide rich information that can be organized and viewed via Social Reports.
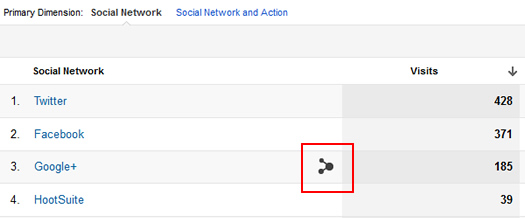
Unfortunately, some of the big players in Social are not participating, like Facebook and Twitter. This means you will only get basic data in your reporting from these networks. Current Data Hub partners include Google+, Delicious, Blogger, Disqus, Diigo, Pocket, etc. You can tell which social network is a data hub partner since there will be a data hub icon next to participating networks. See the icon below.
Back to our example. If you click the “Social Network and Action” dimension, you can analyze Data Hub activities for specific pieces of content. For example, you can view Google+ posts, +1’s, reshares, bookmarks from Delicious, Pocket saves, etc. You can also view a graphical breakdown of the data hub activities to the right. Again, I wish more social networks were data hub partners, so you could get a full view of activities like tweets, likes, etc. from major networks like Twitter and Facebook. That said, this is still valuable, and we’ll get more granular next.
Activity Stream and Special Treatment for Data Hub Partners
You can click the Activity Stream tab to view specific data hub activities across social networks. Sure, it’s cool to see top-level activity like we’ve seen so far, but the activity stream gets much more specific. When clicking the tab, you will see actual conversations and events from across data hub partners. The default tab is the Conversations tab, which will display shares and comments from data hub actions. You will see specific users, their shares, what they wrote when sharing the content, resharing, or commenting on a post. For example, you can view Google+ and Diigo information below for my Wonder Wheel post.
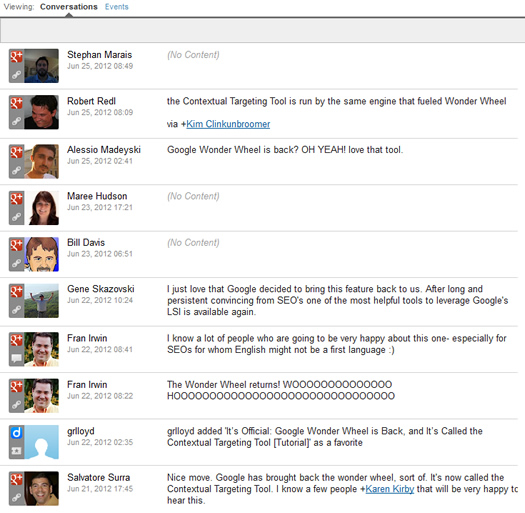
It’s important to note that while analyzing the activity stream (starting with conversations), you’ll notice some great functionality for Google+ content. For example, you can click a person’s photo to view their G+ profile and there are icons that let you know if the person shared an update, reshared someone else’s update, or commented on a G+ update. Then you can click the dropdown arrow on the far right to view additional information, including the Google+ ripple for the piece of content, you can view specific shares on G+, etc. This is awesome data, as you can find influencers, view their posts about your content, view +1’s from other G+ users, etc.

The Power of Ripples
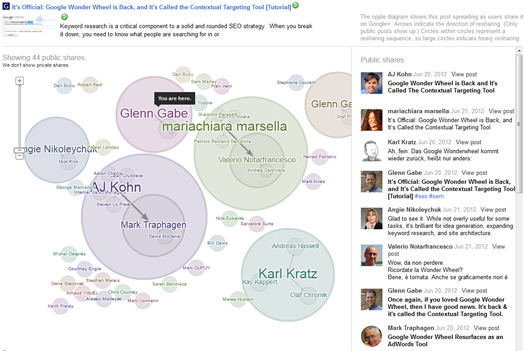
In particular, viewing the Google+ Ripple for a specific URL reveals incredible data. I’ve written previously about how to analyze G+ Ripples, and you should definitely check out that post. Ripples enable you to see how your content was shared across Google+, from user to user. You can also view influencers, sharing sequences, links to each public Google+ post, view shares over time, etc. Spend some time with Ripples… you can find some incredible information.
Events in Activity Stream
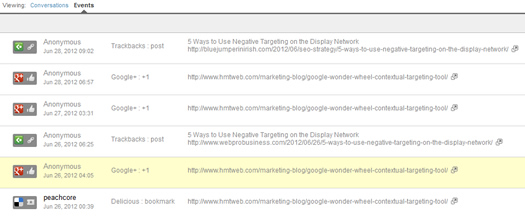
The second dimension in the Activity Stream report is Events. By clicking this dimension, you can view additional information beyond just the conversations people are having about your content. For example, you can view data hub partner events like +1’s, delicious bookmarks, pocket saves, trackbacks, etc. I’ll cover more about trackbacks shortly, but this was a cool addition by Google recently.
Similar to what we did earlier, using the dropdown arrow on the right side enables you to see the actual activity on each social network. For example, selecting “View Activity” for a delicious bookmark takes you to the actual bookmark page. Here, you can view the profile of the person bookmarking your content, view comments, etc. This is a great way to understand what people are saying about your content, find influencers, connect with similar people, etc.
Quick Tip:
By clicking the social network logo in the events list for any action, you can link to a page that shows all activity from that specific social network. For example, clicking the delicious icon in the screenshot below, you will be taken to all delicious events for this specific piece of content.
A Note About Twitter
I mentioned earlier that you can only get advanced level data from Data Hub Partners. That’s true (and unfortunate), but there is some additional data you can get from Twitter. If you click the the link for Twitter when viewing social networks in your reporting, you will see a list of t.co links (shortened links from Twitter). If you move fast enough, you can enter those shortened URL’s in Twitter Search to view the actual tweets. Then you can check out each Twitter user to find influencers, follow them, engage them, etc. Twitter Search does not go back very far, so you’ll need to move fast. You can also use a number of third party tools to mine Twitter data, but that’s for another post. :)

Trackbacks
If you click back to the Social Referral tab, and click the “Social Referrers” dimension, you might see “Trackbacks” listed in the report. Note, you might have to use the rows dropdown at the bottom of the report to reveal additional rows to view trackbacks. If you click the “Trackbacks” link, and then click the Activity Stream tab, you will see inbound links that Google Analytics picked up. Trackbacks will display links to your content from outside your site (inbound links).
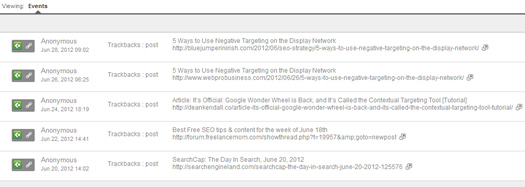
From this report, you can view the pages linking to your content by clicking the link icon next to the URL, or by clicking the arrow dropdown and clicking “View Activity”.
Trackbacks are a Great Addition, But Not Perfect
It’s important to understand the links that your content is building on several levels. First, you can start to understand what people are saying about your content, what types of sites are linking to you, understand the authors of that content, what the comments are saying, etc. That’s all really useful information. Second, you want to understand the SEO power of those links. Are they relevant websites, is the content high quality, is it a spammy website, etc? Third, you can absolutely use this intelligence to connect with influencers, whether that’s the blog author, or people commenting. And no, this isn’t as robust as using Open Site Explorer, Majestic SEO Tools, Google and Bing Webmaster Tools, etc., but it’s nice having this data in Google Analytics.
Social Conversion Data for Specific Content
GA’s Social Reports include a valuable conversion report that displays the last click and assisted conversions from social networks. This is important data to analyze, since you can understand how social networks impact conversion (by directly impacting conversion and/or assisting conversion).
But, the social conversion report is not broken down by content. In order to get that data, you would need to create an advanced segment for social traffic, then view top landing pages with that segment active. Then you can analyze the conversion impact of visits to that piece of content from social networks. At a top-level view, it’s great to see conversion data from each social network, but if you are laser focused on a specific piece of content, then the standard social reports won’t really help you.
Summary – Get Social with Google Analytics
As you can see, Social Reporting was a great addition for Google Analytics. It’s ultra-important to understand the impact of social traffic, what’s being shared across social networks, which influencers are sharing your content, who is engaging that content, etc. It’s also important to analyze specific pieces of content that are being actively shared across social networks. I hope this post explained more about how to find and analyze data for a specific post. But like anything else in digital marketing, you need to test it out for yourself! So target a piece of content, fire up Google Analytics, and hit the social reports. Good luck.
GG

Great post! The wealth of data offered in Google Analytics almost makes up for the complete lack of it in Google Plus.
Hey, thanks. I’m glad you liked my post. There’s some great data in GA’s
social reports, although I do wish there were more data hub partners!
Regarding G+, it will get there eventually. I’m confident in that.
Ripples are awesome, though. Definitely one of my favorite ways to
analyze the sharing of information across a social network. :)
Thanks for explaining this! I didn’t realize that Google Analytics provided all of that information on social media.This is awesome! I never realized that was there, now I’m wondering
about other things. How do you determine what your goal should be for
your blog?