
Google rolled out continuous scroll in the desktop search results for English queries in the United States on December 5, 2022. Continuous scroll enables users to seamlessly continue to page two and beyond without having to click a “next” button at the bottom of the results. This followed Google rolling out continuous scroll in the mobile results in October of 2021 (again, U.S-only for English queries).
Here is Google’s announcement about the rollout to desktop in early December (with a gif of continuous scroll in action):
After the rollout to desktop, many wondered how continuous scroll would impact the visibility of rankings that were beyond page one. For example, for sites with urls ranking on page two, and maybe even the top of page two, the ability for users to easily scroll to additional pages of search results should lead to more impressions, clicks, and conversions. That’s the idea anyway, and something I set out to analyze.
Before continuous scroll rolled out in the SERPs, ranking on page two and beyond meant your listings probably wouldn’t be seen much. Sure, some people would venture to page two and beyond, but most would stick on page one (and just refine their search if they couldn’t find what they needed after scanning the results). But with continuous scroll, users can easily move to the second page of results without having to click a button. The new results just show up as you approach the bottom of the initial set of results.
Analyzing Continuous Scroll in the U.S. Desktop Search Results:
Right after the rollout of continuous scroll on desktop, I published a post explaining how to analyze the change in impressions, clicks, and click through rate based on users being able to seamlessly view more listings in the search results. My tutorial explains how to use the GSC API and Analytics Edge in Excel to bulk export data from GSC, filter by desktop only from the United States, compare timeframes, and then filter by page two and three results. The resulting worksheets quickly provide the changes across metrics when comparing the timeframe before, and after, continuous scroll rolled out.
After publishing that post, I’ve been eagerly waiting for more data to build in order to dig into the reporting across sites. And that’s exactly what I did for a number of sites across verticals. I knew the sites would have a ton of data to analyze, and across verticals, so it should be easier to see differences based on continuous scroll rolling out in the desktop SERPs in the United States.
Below, I’ll cover the methodology I used, the data I analyzed, some interesting (and scary) findings about GSC data, and the impact, or lack thereof, of continuous scroll rolling out in the desktop search results. Let’s jump in.
Methodology:
First, I selected twelve different sites that have a steady and significant amount of traffic from Google organic. Some of the properties are large-scale sites driving a lot of clicks from Google organic, where others were niche sites driving less traffic (but still a good amount of clicks). I made sure the sites were across verticals, and that those verticals weren’t heavily impacted by the holidays (as much as I could). Also, I made sure to focus on just the desktop results from the United States, since continuous scroll did not roll out internationally yet.
Then I used the process I mapped out in my tutorial for analyzing the change in metrics based on exporting data from GSC in bulk, filtering by desktop only from the U.S., comparing timeframes, and then filtering by page two and three results. You can check my tutorial for how to accomplish this using the GSC API, Excel, and Analytics Edge.
When analyzing the data, I made sure to review queries where the average position was about the same before and after continuous scroll rolled out. For example, I wouldn’t review a query that was ranking 24 before the update and then 16 after. That’s a big difference and could obviously impact the data. I looked for queries where the site ranked at about the same position so I could better analyze if continuous scroll was having an impact on visibility and engagement.
Regarding Google organic search traffic for the twelve sites, I have provided the number of clicks over the past three months for each of the sites I analyzed (just so you have a feel for how much traffic they were driving from Google recently).
The sites ranged from 89M clicks to 1.1M clicks over the past three months and spanned a number of verticals:
- Site 1: 89M clicks
- Site 2: 31M clicks
- Site 3: 25.3M clicks
- Site 4: 8.6M clicks
- Site 5: 7.4M clicks
- Site 6: 4.9m clicks
- Site 7: 3.7M clicks
- Site 8: 3.2M clicks
- Site 9: 3.0M clicks
- Site 10: 2.9M clicks
- Site 11: 2.5M clicks
- Site 12: 1.1M clicks
The GSC Void: Dark, Murky, and Inconclusive
First, the reality of filtered GSC data hit hard after exporting data based on query. Barry Schwartz covered this in July of 2022 after Patrick Stox wrote a post explaining what he was seeing across sites with GSC filtering data. It was eye-opening to see how much data was filtered for some sites…
When I checked at the time across sites, I also saw massive gaps in data when exporting based on query. For example, the total at the top of the Performance report in GSC can be much greater than what you see after exporting the data by query (and then totaling the clicks and impressions). And I mean WAY OFF. For some sites I analyzed at the time, I was only seeing 20% of the total after exporting the data. Yes, that means 80% of the data was filtered.
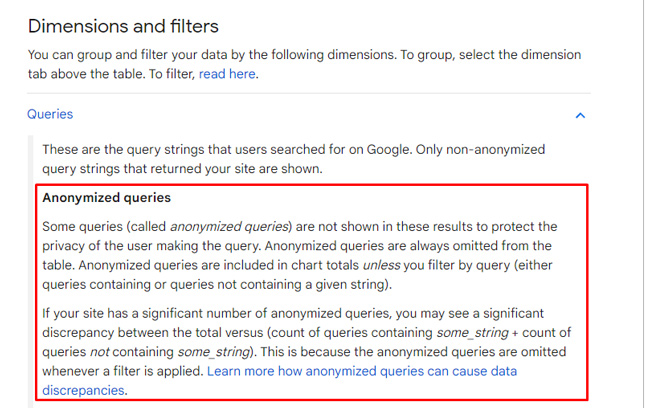
The reason is that Google filters queries based on privacy concerns. In its documentation, which it refined after Patrick’s study, Google explains that it filters “anonymized queries” to protect the privacy of users. And for some sites, it can be a ton of data. It’s worth noting that exporting by page will yield the full results (or close), but exporting by query highlights what I call the GSC void.
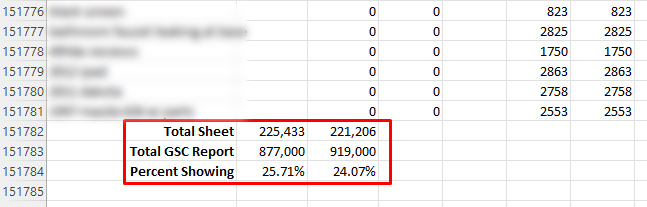
Back to continuous scroll data… For the twelve sites I analyzed, some GSC properties only provided 20-30% of the total data reported in the Performance reporting due to filtering. You read that correctly. That means 70-80% was filtered for those sites.
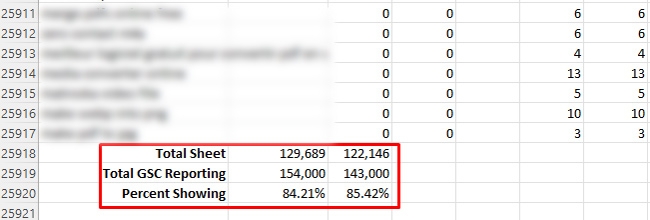
On the flip side, I’ve seen as high as 84% of the data showing (so 16% filtered), but that was the most I could find based on reviewing a number of properties in GSC. Don’t get me wrong, that’s much better than 24%!
When I saw the amount of filtering, I knew I had my work cut out for me with trying to analyze the data. I was hoping there was enough to see changes based on continuous scroll rolling out… One thing was clear, the GSC void was dark and murky.
Dark and Murky: Analyzing the impact to impressions, clicks, and click through rate.
First, “Dark and Murky” isn’t the name of a trendy new drink you can order poolside at a resort. It’s just the first thing I said after going through the data across the sites I analyzed. When I got past the first page of results, the numbers across most of the sites plummet. They drop so much that it’s nearly impossible to draw any conclusions about how continuous scroll is impacting clicks and click through rate from the desktop SERPs.
And from an impressions standpoint, I couldn’t see a consistent trend with the increase in impressions. For some queries, impressions did increase. For others, they dropped. And again, clicks and click through rate were very hard to analyze due to the insanely low numbers beyond page one.
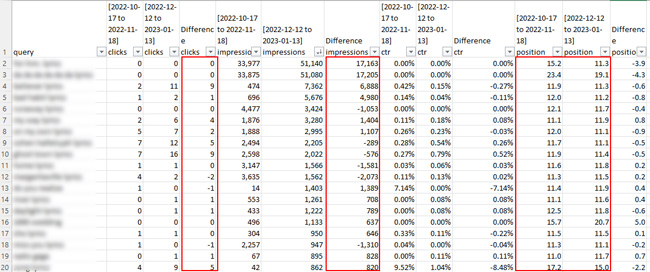
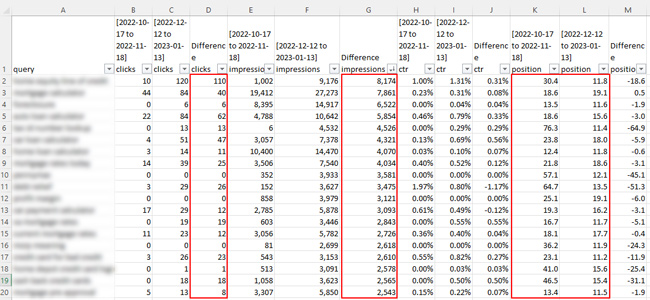
For example, as soon as I checked the spreadsheet for page two results across several of the sites, the number of clicks was inconsequential. That shows you how much data is being filtered, by the way… On page one, some queries are yielding tens of thousands of clicks, or more. Then page two drops to almost nothing? So yes, the GSC void is real and it can severely hamper your analysis.
Here are some screenshots from the spreadsheets for page two of the search results. Get ready to be underwhelmed from a clicks standpoint. :)
But, I mentioned one site that only had 16% of its data filtered (which was the best I came across out the twelve). For that site, you would think I would have enough data to make some conclusions… but not really. Clicks were very low once I analyzed page two and beyond. I could see that impressions increased for a number of queries, but clicks didn’t. And since clicks were so low beyond page one, the difference in click through rate was pointless to review.
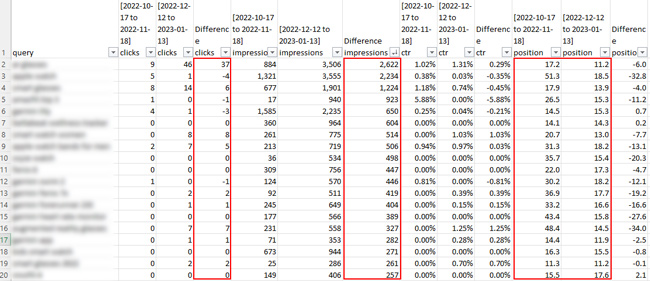
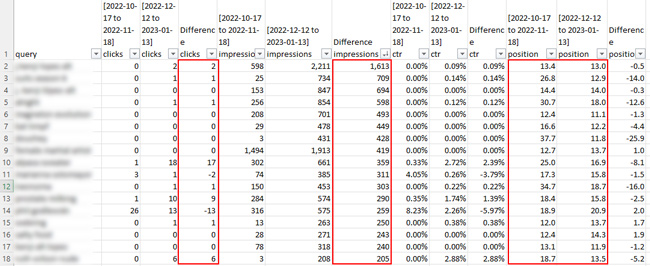
Here is a screenshot from the site that was only 14% filtered:
For example, for one query the number of impressions jumped by 3,110, but clicks only increased by 18. Average position went from 21.3 to 19.0, which is close, but that could have meant a jump from page three of the results to two. Clearly this isn’t enough data to draw any conclusions. The impressions increase is one thing, but the clicks were so low that it didn’t mean much. And to be honest, who really cares about an increase in impressions if clicks don’t follow. For most site owners, this isn’t really a branding exercise. They want the clicks and subsequent conversions! :)
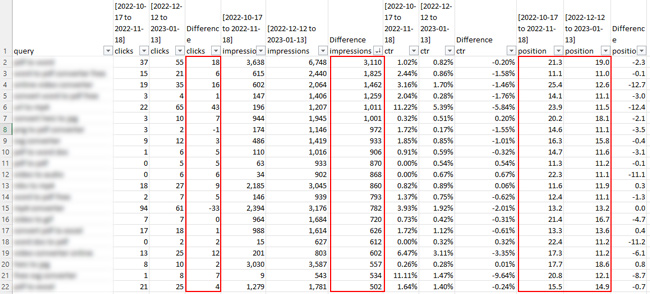
Here’s another site where there was a nice increase in impressions for some queries, and definitely an increase in clicks for some of the queries. That said, some of the increases were due to the site ranking much stronger in the latest timeframe. There was an increase in impressions for some queries when the site ranked about the same position, but there’s just not enough click data to draw any serious conclusions…
Key takeaways based on analyzing Continuous Scroll in the desktop SERPs:
- Based on my analysis across sites, there is NOT much data on page two and beyond to analyze… That’s even the case for large-scale sites with a ton of Google organic traffic. That’s based on GSC filtering anonymized queries.
- I could see an increase in impressions for some queries, but I it was hard to draw any conclusions since there were many that dropped when comparing timeframes as well.
- Clicks and click through rate were even harder to analyze. There weren’t many clicks to report overall beyond page one, which made it very tough to draw any conclusions.
- From a GSC data standpoint, I had severely-limited data based on GSC filtering. This has been reported before, and this study underscored how much filtering is going on. For example, some of the exports were only yielding 20-30% of the data reported in GSC in the Performance reporting (when analyzing by query).
- I do recommend going through this process for your own sites using the tutorial I published (if for no other reason than to see the severe filtering going on with GSC data when exporting by query). Note, you should be able to see the full data if exporting by page, but there are many queries that lead to specific pages (which can muddy waters analysis-wise).
Summary: The GSC Void Limits Analysis of Continuous Scroll in the SERPs
After continuous scroll rolled out in the desktop search results, I was extremely excited to analyze the impact to impressions and clicks based on users scrolling to page two and beyond. Unfortunately, GSC data filtering hampered my efforts big-time. Some sites were only returning 20-30% of the total data based on GSC’s filtering of anonymized queries.
I’ll be sure to update this post if I come across stronger findings based on analyzing continuous scroll across sites. In the meantime, I do recommend going through this process for your own sites. You never know, GSC might not be filtering as much of your data… Good luck.
GG