 As the holidays approach, chances are you will be launching several email marketing campaigns. Busy holiday marketing schedules heavily rely on email to connect with customers, promote holiday sales and offers, and to drive revenue. With the flurry of emails you’ll be sending out, analyzing your campaigns is critical to improving their effectiveness. Utilizing a robust web analytics package is a great way to scientifically determine what works best for your specific customer segments, and maybe more importantly, what doesn’t work. So, I decided to write a post that covers analyzing your email marketing campaigns by properly tagging your email links (for analysis in Google Analytics). Then you can break down and analyze your email creative at a granular level in your analytics reporting.
First let’s define “tagging your online ads”:
Tagging is the process of adding querystring variables to links in your online ads so your analytics package can detect and then associate each link with a campaign. Then you can access reporting based on visitor activity. For example, tagging a banner so you your analytics package knows which website the banner was placed on and which version of the banner led to a click through. The reporting will also provide important metrics for your campaigns such as site activity, sales, conversions, bounce rate, etc. Tagging is critical to understanding how your marketing campaigns are performing.
Breaking Down Your Email Marketing Creative
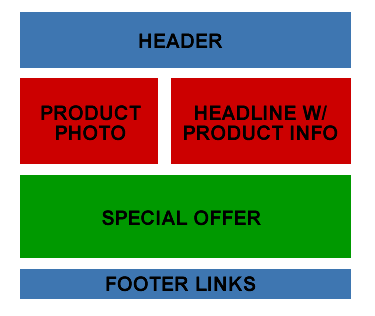
Let’s start with a wireframe for our sample email marketing creative. As you can see below, we have the following areas that we want to track:
1. header with branding
2. product image
3. headline next to product image with product info
4. special offer
5. footer with company links

Tag, You’re It! Tagging Your Email Creative:
In Google Analytics, you need to tag your campaigns so you can properly analyze each campaign in your reporting. You achieve this by tagging each link that you want to track. The four variables that you will utilize in Google Analytics for this example are:
1. utm_source
2. utm_campaign
3. utm_medium
4. utm_content
utm_source
This is the source of your marketing campaign, so for our purposes “InternalEmailList” will work just fine. Just remember to keep this consistent for future campaigns to your internal email list so you can easily segment and aggregate your reporting data in Google Analytics. Other examples of Campaign Source are websites you are advertising with, shopping engines, a search engine like Google or Yahoo, PRWeb, etc. It’s basically the source of your campaign traffic.
utm_campaign
This is simply the name of your campaign. Note, you should use a descriptive name here, since it will show up in Google Analytics under the Traffic Sources tab in Campaigns.
utm_medium
Medium identifies the marketing channel you are utilizing for your campaign, such as email, banners, search, pr, etc. Obviously for our example, we’ll use email.
utm_content
I saved this for last, since it’s what we’ll be focusing on for tracking your email marketing creative. You should use a different value for utm_content for each section or specific link in your creative. This enables you to view reporting based on the content breakdown in your email creative (which will help you determine the value of each element in your email). More on this later.
So, for our example, the utm_content values would look like this:
Header: utm_content=HeaderBranding
Product Photo: utm_content=ProductPhoto
Headline: utm_content=Headline
Offer: utm_content=Offer
Footer Links: utm_content= FooterLinks
Note, this is a simplified example, and you may choose to get more granular in your own email creative. For example, you may choose to tag each specific link in the footer versus tagging all of the links in your footer as “FooterLinks”.
The Full Picture (or should I say “The Full URL”)
I just explained how to set the utm_content variable in your link, but I also mentioned 3 other variables that you should set. Here is what your link would look like for the header element in your email creative using all 4 variables:
https://www.gsqi.com/blog/?utm_source=InternalEmailList&utm_medium=Email
&utm_content=HeaderBranding&utm_campaign=PreThanksGiving
Each of the links in your email should contain this querystring using all 4 of the Google Analytics tracking variables I listed above. You can also utilize Google’s URL Builder to help build your links.
Blast Away!
At this point, you should fully test your creative to ensure everything looks the way it should across email clients, ensure all of the links work properly, ensure you tagged each link correctly, etc. Then blast away and wait for data to come in (and revenue!)
Tracking Your Email Campaign in Google Analytics
OK, so you blasted out your email campaign yesterday and you are eager to see how it’s performing. Log into Google Analytics and click the Traffic Sources tab. Then click Campaigns. You should see all of your campaigns listed here for the time period you selected. For our example, you would see a listing for PreThanksGiving, since this is the name we gave our campaign earlier. Simply click this listing to view reporting specific to this campaign.
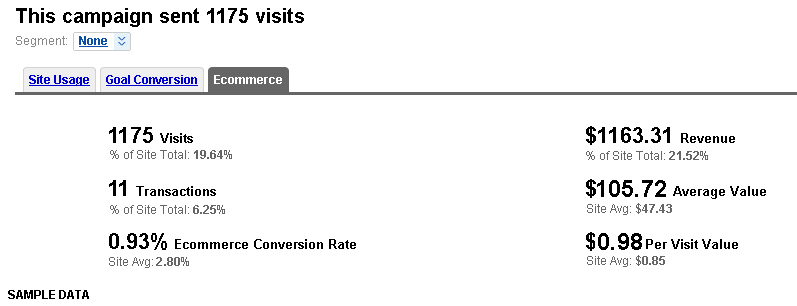
At this point you can see the summary for your email campaign. You can see the number of visitors, avg time on site, bounce rate, etc. You can click the Goal Conversion tab to view the number of conversions from your campaign, and you can also click the E-Commerce tab to view revenue, number of transactions, etc. But you shouldn’t stop there… You can drill in further to view which elements are performing well in your email creative.
Click the image to view a larger version:
View the Breakdown:
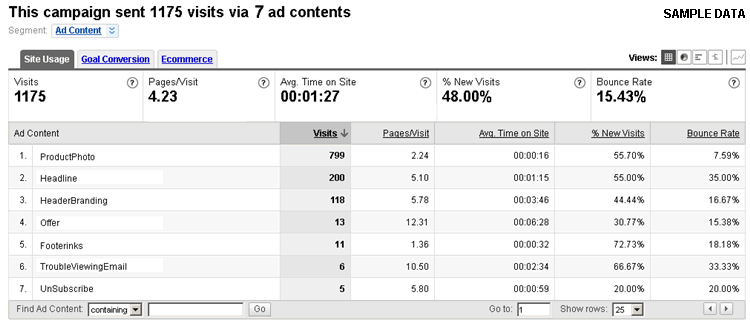
Click the Site Usage tab again in your report. Now, click the Segment dropdown and select Ad Content. You will now see each of the links you tagged in your email creative. Cool, right? Now you can view detailed reporting based on each element in your email. Why is this important? You may find interesting customer behavior that will enable you to drive better performance in future blasts. You might see that 75% of visitors clicked the product photo versus the offer. Based on that piece of data, maybe you expand your imaging in the email to include other views of the product to see if it increases your click through rate and sales. Or, you might find that a headline next to the photo draws more visitors than a headline above the photo. So on and so forth… You get the picture! When you break it down, your customers are unique and you might find that certain elements perform extremely well and others fall flat.
Click the image to view a larger version:
Back to your reporting… A sample analysis:
Now click the E-Commerce tab and view sales data for each element. You might find the product photo generated 70% of the revenue from the campaign. You might also see 10% of the revenue coming from the footer links. Why? Maybe customers aren’t sure who you are! Most people receive dozens of emails per day from companies they have purchased from. If you are a smaller company that is still building your brand, it might take customers a second or two to remember who you are… If you see trending that shows people clicking through your About Us link, you might want to promote your company and/or brand more in the email creative. i.e. Provide an About Us paragraph in the right sidebar of the email. This is obviously just an example, but you might find some important data from reviewing reporting like this… Back to our analysis, if you click the Goal Conversion tab, you can view conversions from each element in your email. Now you can track sales, newsletter signups, RSS subscriptions, etc. for each element in your creative. You might find certain email campaigns generate a lot of newsletter signups but only a few sales. You would obviously want to dig deeper and find out why that is…but you wouldn’t know unless you track it!
In closing…
Using this technique, you can break down your creative and tag each link so you can view detailed reporting for your email campaigns. During and after each campaign, you should check your reporting for trends in customer behavior. Then test out new ideas and drive elements that perform well. Over time, you can refine your campaigns to maximize your email marketing efforts.
So, if I’ve done my job well, your next move is to run down the hall and grab your email marketing coordinator screaming, “Hold That Blast!” so you can tag all of your links! ;-) Then you can enter meetings armed with data versus opinion!
GG
Related Posts:
Black Friday, Cyber Monday, and Now Gobble Thursday – More Holiday Tips for Web Marketers


