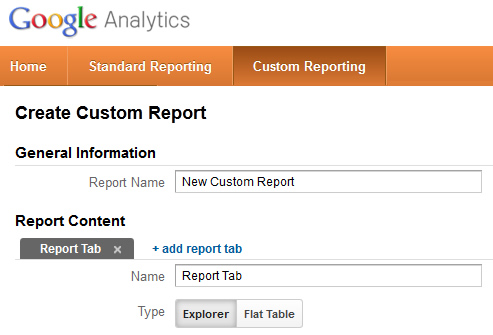
Custom reports in Google Analytics are incredibly powerful.They enable you to tailor reporting, based on your own business, your own conversion goals, key metrics, etc.The problem is that custom reports can be confusing to create. You have metric drilldowns, dimension groups, report views, filters, etc. If you aren’t familiar with creating custom reports, the interface could be daunting. That said, you shouldn’t give up trying to create custom reports! Again, they can be very powerful for analyzing traffic.
In this post, I’m going to walk you through creating a custom report that displays organic search traffic from mobile devices. The report will also enable you to view those visits by location. It’s a nifty custom report for any local business. The report lets you quickly view top keywords leading to your site via organic search (mobile traffic), but also lets you view how many of those visits are from potential buyers (people located near your business).
In addition, Google recently released functionality for customizing a standard report versus having to create every custom report from scratch. This is a great option if you are new to custom reports and want to tailor some of the existing reports in Google Analytics to fit your needs.
Creating a Custom Report from a Standard Report
As I mentioned earlier, we’ll start with a standard report in Google Analytics and tailor it to meet our goals. Since we are going to create a report showing organic search from mobile devices, let’s start with the Mobile Overview report and customize it to display:
- Organic keywords leading to the site (mobile traffic).
- The region those visits are from (i.e. states).
- The cities within those regions that visits are coming from.
- The mobile operating system from those visits (android, iphone, etc.)
The goal of the report is to know the organic keywords leading to the site from mobile visits, and how many of those visits are from potential customers (people located near your business).
How to Create the Custom Report (from a Standard Report)
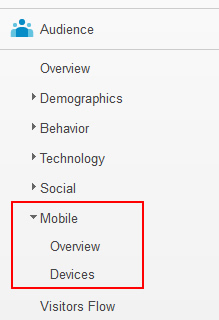
1. Open up Google Analytics, click the “Audience” tab, and then expand the “Mobile” link in the left side navigation. Click the “Overview” link to view the Mobile Overview report.
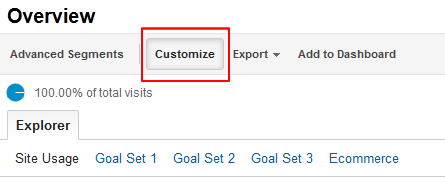
2. Click the “Customize” link in the action bar of the report. This will enable you to customize this report for your own needs (by creating a custom report based on this standard report). Note, not all standard reports can be customized this way. Tabular reports can be customized this way, but you will find other reports within GA that cannot be converted to custom reports:
3. When you click “customize”, the standard report will be loaded into “report builder”. The initial view will show you the current report mapped out already in report builder. Then you can tailor the various elements, based on what you are trying to achieve with your own custom report.
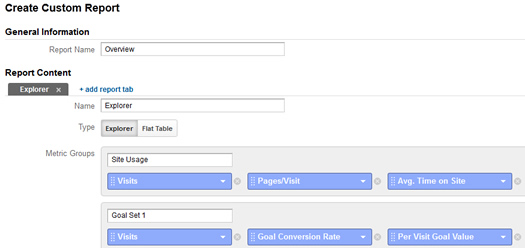
4. You can keep the current metric groups if you want. If you ever want to go back and customize the metric groups, you can by editing the custom report. For example, you definitely want to set up various conversion goals and events so you can better understand quality traffic. Once you do, you can add them to your metric groups so you can view performance by traffic in your custom report.
5. Under dimension drilldowns, you will only see “Mobile” listed. Adding more dimensions will enable you to drill into each level to find more data. As I explained above, we want to drill into mobile traffic to reveal the organic keywords leading to the site. Then we want to view location by region and state. So, let’s add those additional dimensions to our report.
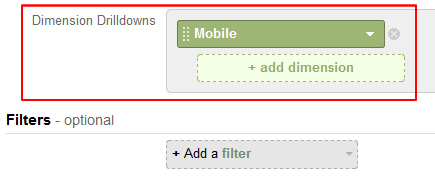
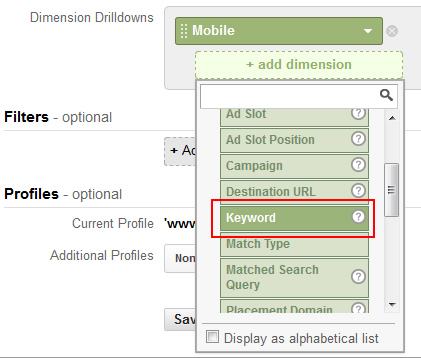
6. Click the “Add Dimension” box in dimension drilldowns and select “Keyword” from the “Advertising” list.
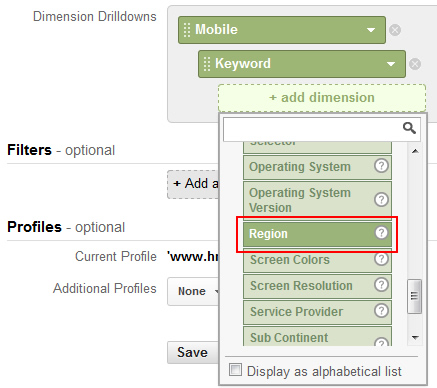
7. Next, add more dimensions to your report. Click the “Add Dimension” box again, and include the “Region” dimension from the “Visitors” list. After adding “Region”, you should go through the same process to add another dimension for “City”.
8. Filter Your Traffic
The last step is to make sure the traffic is only from organic search. We only want to view mobile traffic from organic search, so we need to tell Google Analytics to filter that traffic for us. Click the “Add a Filter” box under the “Filters” category. Select the “Medium” dimension under the “Traffic Sources” list. Then select “include” from the first filter dropdown, leave “Medium” as the dimension, leave “Exact” in the third dropdown, and then enter “organic” in the text box (without quotes). See the screenshot below to follow along. This text tells Google Analytics to include all traffic that exactly matches “organic” as the medium. “Organic” is what’s listed for all organic search traffic.

Congratulations! You just created a custom report, based on a standard report. Click “Save” at the bottom of the report and you’ll be taken to the functioning report in Google Analytics.
You can start drilling into the report by clicking “Yes” in the mobile report, which will reveal all organic keywords from mobile traffic. Then you can click any keyword to view the region those visits are from. If you click the region, you can view the cities within that region. Again, this report can help you identify mobile traffic from organic search, the keywords being searched for, and identify if these are potential customers (based on their proximity to your local business).
Bonus: Access the Custom Report Template
As an added bonus, I have shared the template for this custom report and you can access it by clicking the link below. Once you click the link, you can add this template to a Google Analytics profile and start using the report today. You can also analyze the report setup so you can work through creating similar custom reports. Click the following link to access the custom report for organic search visits from mobile devices.
Summary – Customize It!
I hope this post helped clear up some of the confusion associated with building custom reports in Google Analytics. I love that Google added the ability to customize standard reports, since that’s sometimes all you want to do… If you are new to custom reports, then I recommend starting with a standard report and then customizing that report to fit your needs. Going through that process should help you get more comfortable with working in report builder and could lead to more advanced custom reports. And that can all lead to advanced analysis of your traffic. Good luck.
GG

Hey, thanks a lot for this tutorial. It really helped me as I needed a third dimension to identify a visitor who made a sale. Thank you :-)
Hey, no problem. I’m glad my post could help. Creating a custom report from a standard report is the quickest way to go.
Man, this post is AWESOME.
Google analytics contains so many things we don’t use and are really great.
Thank you.
Hey, thanks Idan. I’m glad you found my post helpful. And you’re absolutely right. GA is packed with functionality and most people only use a fraction of it.
That’s part of the reason I keep writing these tutorials. You should subscribe to my feed to keep up to date on my latest posts. Thanks again.
GG
This is great. I love Google Analytic and they seriously need to send out an email every time they do something like this.
So many functions that I have to dig through and because of that it is probably why I have yet to find this one.
Thanks!
Hi Glen,
Greetings.
You made creating Custom Report easy.
Keyword ‘(not provided)’ shows maximum figure. How do we know these keywords?
I shall keep learning.
Best wishes,
Dr. Ashok Koparday
Thanks Ashok. I’m glad my post was helpful. Regarding “not provided”, it’s a huge problem that’s hard to address. I might end up writing a post detailing some strategies to employ to better understand that data. You should subscribe to my feed to make sure you know when new posts are published. Thanks again.
GG