 Earlier this month, Google Analytics added a new feature, the ability to view benchmarking data across verticals. The idea is to enable you as a website owner to compare your reporting to that of your industry as a whole or to other industries. You would obviously want to do this in order to glean insights about how your website compares in context (and not in a vacuum). Context is very important to have or your web metrics are just numbers. For example, your visitor level might be low or high compared to your niche, but you won’t know that unless you have context (or in this case other comparable data from your vertical.) Overall, I think Google providing benchmarking data is a good start and I’ll explain more below, but it really is just a start… Anyone that does competitive research for a living probably cracked a grin when they saw this very high level information.
How to View Benchmarking Data:
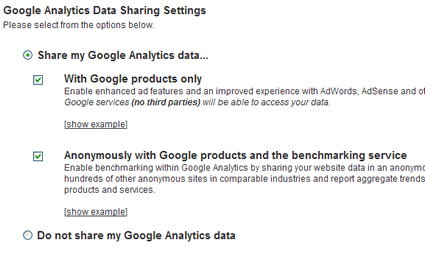
In order to view benchmarking data, you need to enable it in your analytics settings from within Google Analytics. The first page you see after logging in (which shows your various profiles) has a link that says “Edit Account and Data Sharing Services”. After clicking that link, check the box that says, “Share My Google Analytics Data… Anonymously with Google products and benchmarking service”. Then click “Save Changes”. Note that it could take several weeks for this data to show up. You will know if it shows up by clicking the Visitors Tab from within Google Analytics and then the “Benchmarking (BETA)” tab. Then you can dig in.
What Does Benchmarking Reporting Include?
The first thing you will see is a dashboard of reports, including Visits, Pageviews, Pages Per Visit (PPV), Bounce Rate (my favorite metric), Average Time on Site, and Percent of New Visits. Each graph will show you how your site compares with the industry you have selected. So how do you change the industry vertical to compare against? At the top of the report, you can click “Open Category List” to reveal all of the verticals you can select to compare your site’s data to. OK, I’ve revealed problem #1. If you want to compare apples to apples, you might not be thrilled with GA’s initial list of verticals. Again, this is a great start, but if you focus on a vertical that’s not directly reflected in one of the listings, is the process of analyzing the data worth it? Every vertical and type of site will have their nuances, so it’ll be hard to accurately compare data unless your vertical is listed.
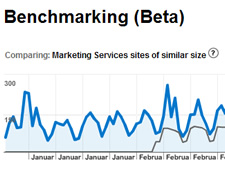
Comparing Visits:
Everyone wants to know how their visitor counts stack up against their industry. This is actually one of the graphs that can help you. For example, if you see a dip in traffic during March, did your industry see the same dip? Did they see an increase instead? What does the trending look like for Q1 for your site versus your industry? Do you want to find partnerships based on seasonal traffic levels? Take a look at various verticals to note similar trending or inverse trending. Maybe you can help each other. You get the point…
Comparing Bounce Rate:
When I first found out that the benchmarking service would include bounce rate, my favorite web metric of all, I was psyched. I’ve written a series of blog posts about bounce rate, since I don’t think there’s a better metric for telling you more as fast as Bounce Rate. That said, I preach that bounce rate at the aggregate level (or site level) doesn’t really tell you much… you need to segment your data to truly understand where the problems lie. For example, social media traffic from Digg might have an 85% bounce rate, where your email marketing campaigns might be at 25%. Paid Search might be at 30% and organic search at 15%. Those numbers analyzed separately can tremendously help you. Combine them and you have a 39% aggregate bounce rate. Is that good or bad? I’m sure you get my point. Back to the benchmarking data. So, looking at the aggregate bounce rate on your site compared to an industry vertical probably won’t give you actionable data. That is, unless your BR is 90%. Then you don’t need benchmarking data anyway, you need some serious help. :)
Comparing Percent of New Visitors:
You want your visitors and customers to come back, right? So this metric can at least give you a feel for how your visitor retention compares to your industry vertical or other industry verticals. Every industry is different, but let’s say you are 30 points higher than your industry vertical for percent of new visitors and you aren’t running any crazy new campaigns (which would skew your data), then you might be on to a customer retention issue… Again, it really depends on your vertical and which marketing efforts you launched during that time period. If you see high numbers for return visitors against your industry totals, then how can you keep that trend going? These are just hypothetical situations, but it could be a valuable process to go through.
Comparing Pageviews:
I’m not going to spend a lot of time on pageviews. This metric bothers me slightly. I’m focused on conversion, so I don’t care if that takes 3 pageviews or 18 pageviews. That said, you can possibly find some interesting data here, like if pageviews in your industry are significantly lower than yours…maybe there is an industry trend for implementing new functionality that radically cuts down the amount of pageviews needed to find the right product. Hypothetical of course, but you might be able to glean insights from the reporting. The other problem is based on rich media functionality or AJAX, which won’t show up as additional pageviews. So, how do 10 pageviews compare to 2 if the 2 is really closer to 10, but completed via AJAX?? Again, I wouldn’t focus on this metric…
Comparing Pages Per Visit:
This could be a valuable metric to analyze compared to your industry vertical if your goal is to keep visitors on your site (advertising model). This essentially answers the question “how sticky is your site compared to your industry vertical?” Are there elements that your competition is using that increases their pages per visit? Is your site much stickier on average? Why is that? Did you just implement new content areas or various types of media content like video? For an e-commerce site, this isn’t as big of a deal. Again, if it takes my visitors 5 pages to convert or 10 pages, I don’t necessarily care. I want to provide the right information to the right people at the right time in order to build trust and convert them to a customer. It’s not always about speed…
Average Time on Site:
This is similar to pages per visit to me. Again, it really depends on your type of site. Are you trying to keep visitors on your site longer based on your business model? How are you achieving this? Did you implement social media functionality? Did you just implement video content? Is there messaging functionality? How does your site’s average time on site compare to your vertical? Or to similar verticals? A low average time on site compared to your industry vertical could indicate a problem with your campaigns, content, or navigation.
To summarize, I think Google Analytics has taken a step in the right direction with providing benchmarking information. It’s not elaborate and deep, but it does give you a decent comparison against your industry vertical and to other verticals. You’ll have to take some of the data with a grain of salt and really drill into your own analytics to glean insights. Maybe some of the GA benchmarking data pushes you to do additional competitive research using more elaborate tools like Hitwise. Just remember that context is everything and competitive research tools and services give you that context. So go ahead and compare away! :)
GG