 The latest version of Google Analytics (v2) arrived a few weeks ago, and although I’m a big Coremetrics fan, I am also an advocate of Google Analytics. I have several clients that use Google Analytics and I also use it for my own websites. The new version is really strong and I plan to write several posts about the new features over the next few months. Today I wanted to begin my review with some of the top features that I use on a regular basis. Let’s jump right in!
The New Interface:
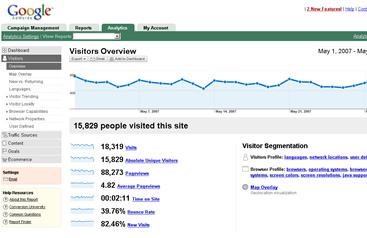
Well, you can’t miss this one when you log in. :-) The new interface is extremely slick. Google obviously worked very hard to make it as easy as possible to find the information you are looking for and in as few clicks as possible. For example, clicking the Visitors tab, you are presented with trending in the top area (along with a dropdown for changing the metric). Then you are presented with additional key metrics below the trending graph along with links to even more information (a good drilldown feature). The trending graph is flash-based and enables you to hover your mouse over a time period to see data in real time. Very nice. Using the dropdown, I can easily change the metric from visitors to bounce rate, pages per visit, etc. It’s fast and there is no refresh needed…and no need to jump to additional pages.
Screenshot of New Interface:
Revenue Just a Click Away:
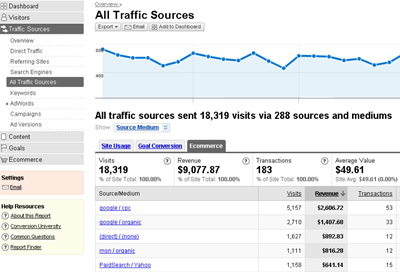
If you are running an e-commerce site, then revenue is what you are looking for, right? With the new version of Google Analytics, e-commerce metrics are simply a click away. For example, if I click the Traffic Sources tab, then click Referring Sites, I am presented with site usage information (like visits, pages/visit, avg. time on site, etc.) However, there are two more tabs next to Site Usage, which are Goal Conversion and e-commerce. Clicking e-commerce now shows me Revenue for each referring site. I did not have to jump to another page and I didn’t even have to refresh the page. Again, fast and slick. Get me the information I want as quickly as possible. Then, I can click on a specific referring site to see more information. For example, I can segment Referral Path and see where visitors came from on the referring site, or segment Visitor Type to see if they are a new or returning visitor. Note that the e-commerce tab is present on many reports, enabling you to quickly match visitors with revenue. i.e. Click the New vs. Returning tab under Visitors and you can easily see the revenue from each segment (as well as goal conversion).
Screenshot of e-Commerce:
Traffic Sources:
Many people involved with web analytics are fanatical about checking which sites are sending traffic their way. Was it from a blog post, an article, social media, search engines, etc. The Traffic Sources tab enables you to quickly find the information you are looking for, as well as revenue associated with those sources. For example, if I click All Traffic Sources under the Traffic Sources tab, I am presented with a list of sites/channels that have sent traffic our way. So, I see that Google Organic ranks second in sending traffic our way for the time period I selected. Then I quickly click e-commerce to see revenue totals. It shows me that Google Organic was the third highest revenue generating traffic source. So, I’m intrigued…I click the link for Google Organic, which gives me more information about the channel. I see trending over time, I can segment the traffic (maybe by landing page so I can see where Google organic visitors are landing on the site), and I see other key metrics like pages/visit, bounce rate, and avg time on site.
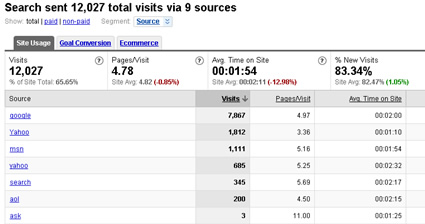
If I click the Search Engines Tab under Traffic Sources, I see the top search engines that sent traffic our way. I can click each search engine link to see the actual keywords and associated revenue per keyword. Fast, easy, and extremely powerful. Also note that there are three links at the top of Search Engines page (under the trending graph). The links enable you to select Total Search Engine Data (both paid and non-paid), Just Paid Search Data, and Just Non-Paid Data (organic). Again, no post back, no jumping to additional pages, it’s all right there on one page.
Under Traffic Sources, there are also tabs for Referring Sites, Direct Traffic, AdWords (to track your AdWords Campaigns), and Campaigns (to track non-AdWords campaigns). These other tabs deserve their own blog post, so maybe I’ll cover them in Part 2.
Screenshot of Search Engine Traffic Source:
The Map Overlay Feature: Wow!
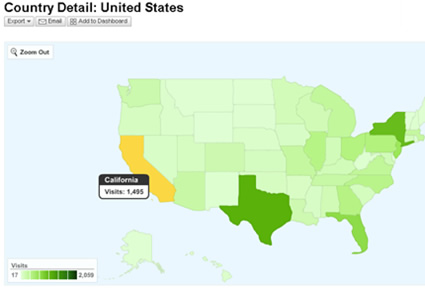
Under the Visitors tab is a feature called Map Overlay. Now, if you ever wanted to segment your visitors by location easily and efficiently, the folks at Google have really stepped up and given you what you needed. I am first presented a map of continents that sent traffic our way, so I click the Americas to drill down. Then I click North America. By the way, if you hover your mouse over a continent, country, city, etc, you can see the data in real time. Also, you can segment the data by using the dropdown I have mentioned throughout this post (so you can see revenue, bounce rate, conversion rate, etc. for each location.) Yes, impressive. Back to my example. Now I see all 50 states, each a shade of green, based on the number of visits. It looks like California sent the most traffic (it’s the darkest green), so I click on the state to drill down. Now I am listed with the cities that sent traffic our way. I notice that Los Angeles tops the list. So I click e-commerce to see how much revenue the city has brought in…can you see the power of this feature?? Then I click on the city link to see more data, like trending over time for key metrics. Needless to say, this is a powerful feature that I hope more people find out about.
Screenshot of Map Overlay:
Exporting and Emailing Reports
Google Analytics v2 has made it easy to export and email reports from the interface. In almost every report, you can click Export at the top of the screen and you are presented with several options. You can export the report as a PDF, XML, CSV, or TSV file. If you want to send the report to someone else, click the Email tab. Here you can enter email addresses, a subject line, description, and then choose a format for the report. In addition, you can easily schedule reports to be sent on a daily, weekly, monthly, or quarterly basis. The email feature is what I use extensively, and it works great. How many times have you found something in your reporting, jumped back, and said “Darn…Jim would love to see this…” Well, simply click the email tab and in seconds your report is on its way.
Summing Up Part 1 of My Review…
I can keep going here…but as you can see, the new version of Google Analytics is a powerful tool for analyzing your web operation. I wanted to hit on some of the features that I use on a daily basis and I definitely plan to keep my review going with additional posts. I am impressed with the new functionality and ease of use of the new version. As I said earlier, I use other web analytics programs as well, but for the money (it’s free), Google Analytics is a great package. There are some limitations as compared to a package like Coremetrics (read more about attribution windows here), but if you need a cost effective and powerful way to analyze your web operation, then you should definitely take a hard look at Google Analytics. If you want to learn more, then definitely check out Avinash’s blog (he is the master, the official Google Analytics evangelist, and is known in the industry by just his first name!)
Wait a minute…just picked up something in the new Google Analytics that Jim would love to see {clicking email tab, copy and paste his email address, and poof, he’s getting a pdf shortly}. :-)
Have fun!
GG