We all know that having a strong analytics setup is important. Marketing without measurement is a risky proposition for sure. But in a multi-device world, it’s not as easy to make sure your setup is accurately tracking what you need – or tracking at all. And if your analytics code isn’t firing properly across smartphones, tablets, and desktop computers, your data will be messy, incomplete, and inaccurate. And there’s nothing that drives a marketer crazier than flawed data.
A few weeks ago, Annie Cushing tweeted a quick question to her followers asking how everyone was testing their Google Analytics setup via mobile devices. This is something many digital marketers grapple with, especially when you are trying to track down problems. For example, I do a lot of algorithm update work and often dig into the analytics setup for a site to ensure we are seeing the full drop in traffic, conversion, revenue, etc.
My knee-jerk response was to check real-time reporting in Google Analytics while accessing specific pages to ensure those visits were being tracked, in addition to events. That could work, but it’s not as granular or isolated as you would want. I also mentioned to Annie that using a chrome extension like User Agent Switcher could help. That wouldn’t document the firing of analytics code, but would let you see the source code when accessing a webpage via a specific type of smartphone or tablet. But again, you couldn’t see the actual firing of the code or the events being tracked. And that’s obviously an important aspect to debugging analytics problems.
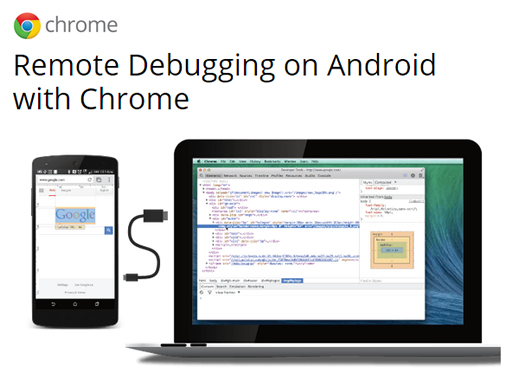
A Solution – Remote Debugging on Android with Chrome
So I did what I typically do when I run into a tricky situation. I find a solution! And for Android devices, I found a solid one. Many of you might be familiar with Chrome Developer Tools (on your desktop computer). It holds some outstanding functionality for debugging websites and web applications. But although it’s extremely helpful for debugging desktop webpages, it didn’t really address the problem at hand (out of the box), since we want to debug mobile devices.
So I started to research the issue and that’s when I came across a nifty technique which would allow you to connect your Android device to your desktop computer and then debug the Chrome tabs running on your mobile device from your desktop computer. And since I could use Chrome Developer Tools to debug the tabs on my desktop computer, I could check to see if Google Analytics was indeed firing when accessing webpages via my Android device. Awesome.
So, I spent some time testing this out and it does work. Sure, I had to jump through some hoops to get it to run properly, but it finally did work. Below I’ll cover what you’ll need to test this out for yourself and how to overcome some of the problems I encountered. Let’s get started.
What You’ll Need
In order to debug GA code running on your mobile device, you’ll need the proper setup both on your desktop computer and on your Android device. In its simplest form, you’ll need:
- Chrome installed on your desktop (version 32 or later).
- Android 4.0 or later.
- A USB Cable to connect your device to your computer.
- Android SDK {this will not be required for some of you, but others might need to install it. More on that situation below}.
If you run into the problems I ran into, you’ll need the Android SDK installed. I already had it installed since I’ve been testing various Android functionality and code, so it wasn’t a big deal. But you might need to install it on your own. I wouldn’t run to do that just yet, though. If the straight setup works for you, then run with it. If not, then you might need to install the Android SDK.
If you are confident you have the necessary setup listed above, then you can move to the tutorial listed below. I’ll walk you through how to debug Chrome tabs running on your mobile device via Chrome on your desktop computer. And yes, we’ll be isolating Google Analytics code firing on our Android devices to ensure you are tracking what you need.
How To Debug Google Analytics on Your Android Device – Step-By-Step Instructions
- Enable USB Debugging on Your Android Device
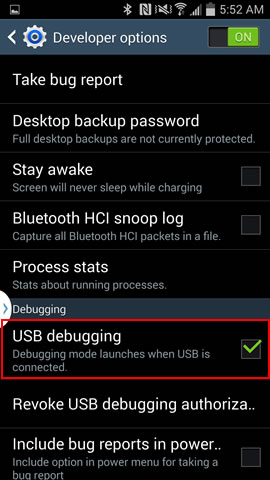
Access your settings on your Android device and click Developer Options. On my device, that was located in the more “More” grouping of my settings and under System Manager. If you don’t see Developer Options, then you need to enable it.You can do that by accessing Settings, tapping About Phone or About Device and tapping Build Number seven times. Yes, that sounds extremely cryptic, but that’s what you need to do. Once you do, Developer Options will show up in under System Manager in your phone’s settings.
Then you can check the box to enable USB Debugging on your device. You will need to do this in order to debug Google Analytics in Chrome on your device.
- Enable USB Discovery in Chrome (on your desktop)
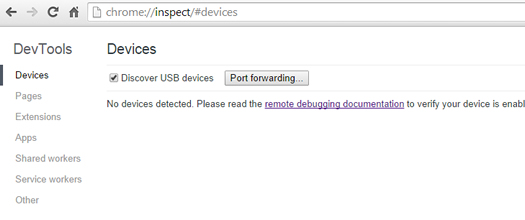
Next, type chrome:inspect in a new tab in Chrome on your desktop. Ensure “Discover USB devices” is checked on this screen.
- Connect Your Phone To Your Computer via USB
- Allow USB Debugging
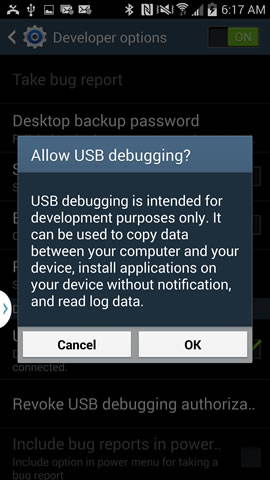
When you connect your phone to your computer, you should see a dialog box on your phone that asks you if you want to allow USB debugging. Click OK. Note, if you don’t see this dialog box, debugging your mobile device from Chrome on your desktop will not work. I provide instructions for getting around this problem later in the tutorial. If you are experiencing this problem, hop down to that section now.
- Fire up Chrome On Your Mobile Device
Start Chrome on your Android device and access a webpage (any webpage you want to debug). - Inspect With Chrome on your Desktop
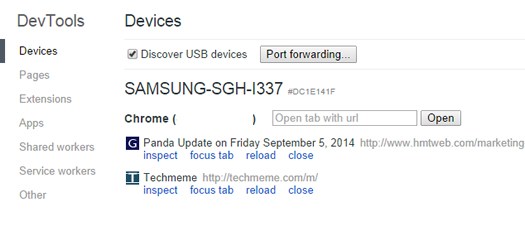
Once you open a webpage in Chrome on your mobile device, access Chrome on your desktop and visit chrome:inspect. Once you do, you should see your device listed and the various tabs that are open in Chrome on your Android device.
- Click Inspect To Debug The Mobile Tab
When you click “inspect”, you can use Chrome Developer Tools on your desktop to debug the mobile web view. You can use all of the functionality in Chrome Developer Tools to debug the webpage open on your mobile device. - Click the Network Tab in Chrome Developer Tools
By accessing the Network Tab, you can view all network activity based on the webpage you have loaded in Chrome on your mobile device. That includes any resources that are requested by the webpage. Then reload the webpage on your mobile device to ensure you are seeing all resources. - First Check for GA.js
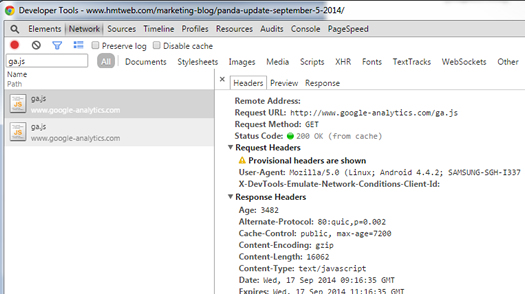
When you load a webpage on your mobile device, many resources will be listed in the network tab. But you should look for ga.js to see if the Google Analytics snippet is being loaded.Tip: You can use the search box and enter “ga.js” to filter all resources by that string. It’s an easy way to isolate what you are looking for.
- Next Check for utm.gif
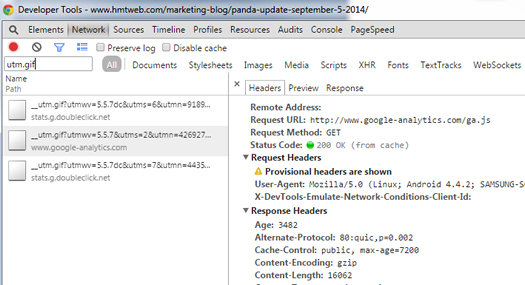
After checking for ga.js, you should look for the tracking pixel that’s sent to GA named utm.gif. If that is listed in the network panel, then your mobile webpage is tracking properly (at least basic tracking). Again, you can use the search box to filter by utm.gif.
- Bonus: Advanced Tracking
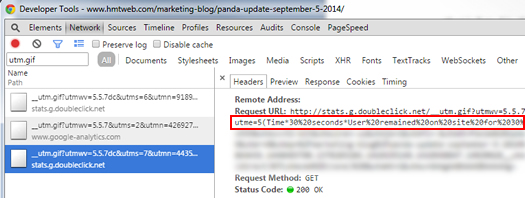
If you are firing events from mobile webpages, then you can see them listed here as well. For example, you can see an event being fired when a user stays on the page for more than 30 seconds below. So for this situation, we know that pageviews are accurately being tracked and the time on page event is being tracked via mobile. Nice.
A Note About Troubleshooting
I mentioned earlier that if you don’t see the “Allow USB Debugging” dialog on your mobile device when you connect your phone to your computer, then this setup won’t work for you. It didn’t initially work for me. After doing some digging around, I found the legacy workflow for remote debugging on Android.
By following the steps listed below, I finally got the prompt to show up on my mobile device. Then I was able to debug open Chrome tabs on my Android device.
- Install the Android SDK (if you don’t already have it installed)
You can learn more about the SDK here and download the necessary files. - Kill the ADB Server
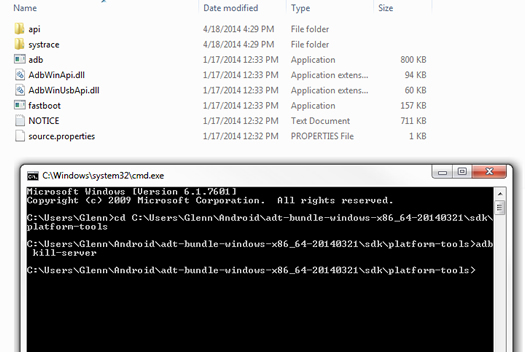
Use a command prompt to access the “platform-tools” folder in the SDK directory and then issue the following command: adb kill-server. Note, you should use the cd command to change directory to the folder containing adb. That’s the platform-tools folder in your Android SDK directory.
- Revoke USB Debugging on Your Android Device
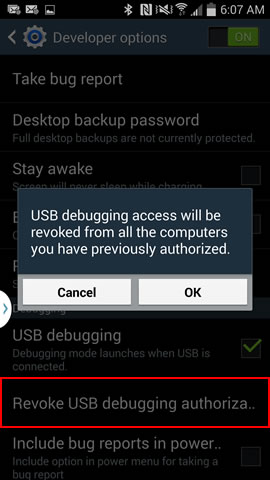
Disconnect your phone from your computer. Then go back to Developer Options on your Android phone and tap Revoke USB debugging authorization.
- Start the ADB Server
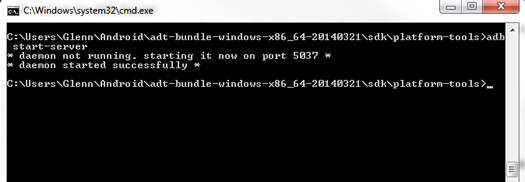
Now you must restart the adb server. Use a command prompt, access the platform-tools folder again, and enter the following command: adb start-server.
- Reconnect Your Device To Your Computer
Once you reconnect your device, you should see the “Allow USB Debugging” dialog box. Click “OK” and you should be good to go. This will enable you to debug Chrome tabs running on your mobile device via Chrome running on your desktop. - Open Chrome on Your Android Device
Go ahead and open a webpage that you want to debug in Chrome on your Android phone. Once it’s loaded in Chrome in Android, you can follow the instructions listed earlier for using the network panel to debug the GA setup.
Summary – Know When Google Analytics is Firing on Mobile Devices
So there you have it. There is a way to debug the actual firing of GA code on your Android devices and it works well. Sure, you may need to go the extra mile, use the legacy workflow, and install the Android SDK, but you should be able to get it working. And once you do, you’ll never have to guess if GA is really working on Android devices. You’ll know if it is by debugging your Chrome tabs on Android via Chrome running on your desktop. Good luck.
GG

