I’ve written extensively in the past about Bounce Rate both here on my blog and on Search Engine Journal. Bounce Rate is an incredibly powerful metric, and can help marketers better understand the quality of their traffic, and the quality of their content. If you’re not familiar with Bounce Rate, it’s the percentage of visits that view only one page on your site. They find your site, view one page, and leave. As you can guess, that’s usually not a good thing.
Traffic-wise, high bounce rates can raise red flags about the quality of traffic from a given source, campaign, or keyword. For example, imagine spending $1500 in AdWords driving visitors to your site for a certain category of keywords and seeing a 92% bounce rate. That should raise a red flag that either the visitor quality is poor or that your landing page is not providing what people are looking for. For example, maybe visitors are looking for A, B, and C, but are getting X, Y, and Z from your landing page. That could very well cause a bounce.
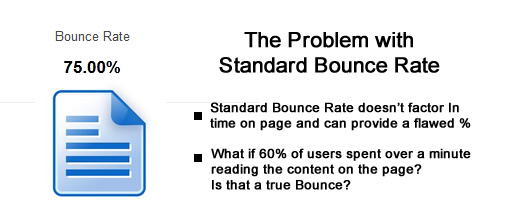
But, that’s not the full story for bounce rate. And I find many people don’t understand how analytics packages calculate the metric. Here’s a scenario that shows a serious flaw. What if someone visits your site, spends 15 minutes reading a blog post, and then leaves? If there’s that much engagement with your content, it probably shouldn’t be a bounce, right? But it is. Since the user viewed just one page, Google Analytics has no way to determine user engagement. Therefore, it’s counted as a bounce. Yes, it’s a huge problem, and could be tricking webmasters into making changes when they really don’t need to.
Actual Bounce Rate
Over the years, there’s been a lot of talk about how Google and Bing use bounce rate as a ranking factor. For example, if the engines saw a page with a very high bounce rate, maybe they would use that against the page (which could result in lower rankings). Add the Panda update, which targets low quality content, and you can see why SEO’s became extremely concerned with bounce rate.
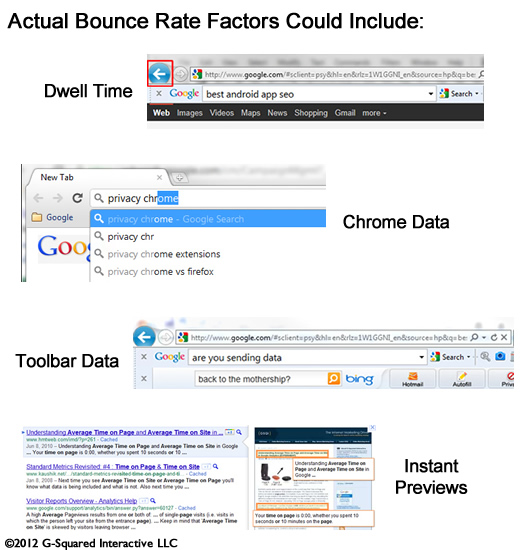
In August of last year, I wrote a post on Search Engine Journal about Actual Bounce Rate. The post explains some of the mechanisms that Google can use to determine actual bounce rate, and not just the standard bounce rate that Google Analytics provides. For example, dwell time, toolbar data, Chrome data, etc. The core point of the post is that Google has access to much more data than you think. Therefore, don’t focus solely on the standard bounce rate presented in Google Analytics, since the actual bounce rate is what Google could be using to impact rankings.
Google Introduces “Adjusted Bounce Rate”
So, given what I just explained, is there a way to gain a better view of actual bounce rate in Google Analytics? Until recently, the answer was no. But, I’m happy to announce that Google Analytics released an update in July that enables you to view “Adjusted Bounce Rate”. It’s not perfect, but it’s definitely a step closer to understanding actual bounce rate.
The Definition of Adjusted Bounce Rate
By adding a new line of code to your Google Analytics snippet, you can trigger an event when users stay for a minimum amount of time. That amount of time is determined by you, based on your specific site and content. So, adjusted bounce rate will provide the percentage of visits that view only one page on your site and that stay on that page for less than your target timeframe. For example, you can set the required time to 20 seconds, and that time would be used to calculate the bounce rate numbers used in your reporting. If users stayed less than 20 seconds, then it’s a bounce. If they stayed longer than 20 seconds, it’s not a bounce (even if they visited just one page).
Changes Needed
As I mentioned above, you need to add one line of code to your Google Analytics snippet. Here is the revised snippet (from the Google Analytics blog post about adjusted bounce rate):
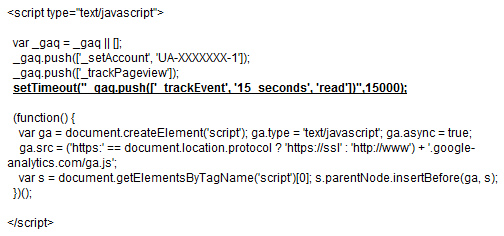
Note, that new line needs to be added to your Google Analytics snippet on every page of your site. Also, the piece of code that includes 15000 represents the time in milliseconds. 15000 equals 15 seconds. You can adjust that based on your own site and content. For some sites, you might set that to 30 seconds, 1 minute, or more. The minimum is 10 seconds.
Impact, and a Real Example
You might be wondering how this actually impacts your reporting. Does changing that line of code really impact your bounce rate numbers? Well, it does, and it can radically change your bounce rate numbers. And that’s a good thing, since it will give you a closer look at actual bounce rate since time on page is now factored in. Remember my example above about a user spending 15 minutes on a post and it’s counted as a bounce? Well that wouldn’t be a bounce if you added this code. Let’s take a look at an example that demonstrates adjusted bounce rate.
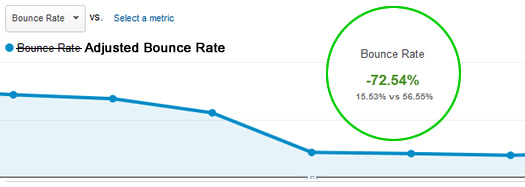
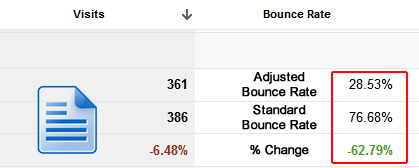
Below, I’ve included the metrics for a page that was showing an 76.7% bounce rate. Clearly, that’s not a great bounce rate, and it could be driving the webmaster to make changes to the content. But, check out the bounce rate after we started calculating adjusted bounce rate. Yes, you are seeing that correctly. It’s now only 28.5%. That means 71.5% of users are either visiting other pages on the site or staying on the page for longer than 20 seconds (which is the time the company is using to calculate adjusted bounce rate). And by the way, the new bounce rate is 62.8% lower than the original bounce rate percentage. That’s a huge swing.
What This Means to You & How This Could Be Better
As a marketer, bounce rate is an extremely important metric. But, you need an accurate number to rely on if you plan to make changes. That’s why I wrote about actual bounce rate last summer. Adjusted bounce rate enables you to add another ingredient to the standard bounce rates calculated by Google Analytics. By understanding the minimum time spent on the page, you can gain intelligence about how users are engaging with your content. Are they hitting your page and immediately leaving, or are they at least spending 20 or 30 seconds reading the content? There’s a big difference between the two (especially for SEO).
Understanding adjusted bounce rate can help you:
- Refine the right pages on your site, and not just ones that show a high standard bounce rates.
- Better understand the quality of your top landing pages from organic search. Do you have a quality problem, or are users spending a good amount of time with that content? Adjusted bounce rate can help you understand that.
- Better understand the quality of campaign traffic. Seeing a 95% bounce rate is a lot different than 25%. Sure, you want conversions from campaign traffic, but engagement is important to understand as well.
- Troubleshoot SEO problems related to Panda. When a Panda update stomps on your site, you should analyze your content to determine what’s deemed “low quality”. Adjusted bounce rate is a much stronger metric than standard bounce rate for doing this.
How Adjusted Bounce Rate Could Be Improved – Revealing Dwell Time
I would love to see dwell time added to Google Analytics somehow. Dwell time is the amount of time someone spends on your page before hitting the back button to the search results. Duane Forrester from Bing explained that they use dwell time to understand low and high quality content. As an SEO, imagine you could understand which pages have high dwell time. That would be incredible intelligence to use when trying to enhance the content on your site.
Summary – Adjusted is Closer to Actual
Again, I believe this is a great addition by the Google Analytics team. Adjusted bounce rate can absolutely help you better understand the quality of content on your site, and the quality of traffic you are driving to your site. I recommend adding the line of code to your Google Analytics snippet today, and then analyze how your bounce rates change. I have a feeling you’ll be surprised.
GG
