 I truly enjoy speaking with people about web marketing. Actually, some will say that you can’t shut me up! I had a great conversation with a marketing manager the other day about sources of revenue for a website. He wasn’t extremely familiar with how web analytics packages work, so I was explaining how you can find out which referring sites are the most valuable to your business. The conversation took off (I could literally see a light bulb going on above his head) so I pulled out my laptop and started showing off some of the functionality in Google Analytics. Based on that conversation, it hit me that a blog post detailing the Referring Sites report in Google Analytics would be a good idea. And here it is!
What’s a Referring Site?
The definition of a referring site is any website (blog, forum, affiliate, etc.) that sends visitors to your website. That may be a bit vague, so let me expand on that definition. In most web analytics packages, traffic is broken down by referring sites, search engine traffic, and direct traffic. These are the most basic sources of traffic for your website. Back to referring sites, so a blog post that mentions your product, a social media site with a link to your website, and a link from an affiliate website are all examples of a referring site. The beautiful part about the top web analytics packages is that they all provide detailed reporting for referring websites. As you know from previous posts, I’m a big advocate of both Coremetrics and Google Analytics, but this post just focuses on the referring sites report in the latest version of Google Analytics.
So What Can You See in the Referring Sites Report?
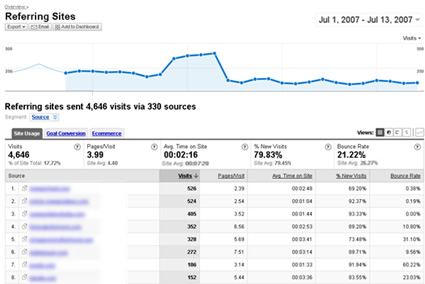
Plenty. Let’s start with the top level referring sites report. As usual in Google Analytics (GA), you can view trending at the top of the report with the list of referring sites at the bottom of the report. You can view a summary of the data you’re analyzing right below the trending and you can easily view the referring sites data by Site Usage, Goal Conversion, and E-commerce. By the way, GA has one of the most intuitive user interfaces among the most popular web analytics packages. Under Site Usage, you can see statistics such as Visits, Average Time on Site, and Bounce Rate, which provides a great starting point. In addition, Google Analytics enables you to visit the referring site right from the report (in a new window). I love this feature for when I see a new referring site show up and I’m not familiar with the website in question. At the top level of this report, you can also click Goal Conversion to see the conversion rate for all of your events, again, broken down by referring site. So, you can see Ecommerce conversion rate, RSS subscriptions, newsletter registrations, etc. for each referring site in your report. Last, but definitely not least, you can click the E-Commerce tab to see revenue by referring site. In addition, GA enables you to segment your data with a quick dropdown labeled “Segment”. I’ll cover this later, but as an example, you can click the segment dropdown and choose “Landing Page” to see the top landing pages that people visit from your referring sites.
Screenshot of the Referring Sites Report in Google Analytics:
–Note, these are just sample screenshots. They don’t match the examples.–
So in just minutes, you were able to see your top referring sites by visitors, goal conversion, and revenue. Now, isn’t this a great way to determine the value of a site linking to you? Imagine this…a website you just recently advertised with said, “We sent 14,000 visitors your way last week. Isn’t that outstanding?” Well sure, but it looks like 60% of those visitors bounced, only 3% signed up for our newsletter, and those 14,000 visitors only generated $400 in revenue. It’s powerful to have that data. :-)
Drill Into Your Referring Sites Report
Now many of you might be excited about what I just explained above. But why stop there? {OK, I don’t mean to sound like a late night tv commercial for the craftmatic bed!} Let’s go one layer deeper into the referring sites report. I’ll click one of the top referring sites in the report. By clicking the site, you are now telling Google Analytics to focus on this one site and give you more data about this referring site. Once in the report, you will see trending again up top, which is a great way to see data over time for this specific website. For example, you might see a spike in activity, a gradual trend upwards or downwards… Also notice that GA provides the same report layout, keeping it consistent while you analyze different activities. This makes it very easy to find what you’re looking for and to become extremely proficient at finding the data you need. You’ll notice the segment dropdown again, this time set to Referral Path, which is the actual path from within the referring website (where visitors actually came from.) This is outstanding because you can now find the exact location on the site that people are finding your link or advertisement. I can’t tell you how many times a new referring site pops up, and I immediately want to see the actual page where the link resides. Was it a blog post, a mention on a forum, one of our ads, etc? GA enables you to view the URL in a new window right from the reporting.
Screenshot of a Specific Referring Site in Google Analytics:
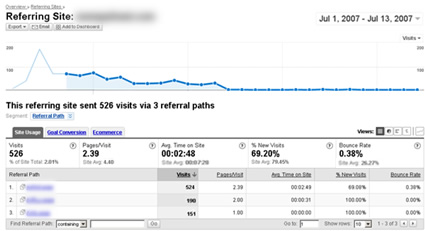
So now we are getting more granular. At the top level, you knew that x amount of visitors came from the website. Now you can see x number of URL’s within the referring site that drove visitors to your website. And, you can easily click each tab like we did earlier to view each URL by Site Usage, Goal Conversion, and E-commerce. In addition, you can use the “Segment” dropdown to segment your data. For example, you can choose Landing Page to see which pages on your website visitors are landing on, you can click City or Region to see where they are geographically located, or you can click User Defined if you set up any custom segmentation. For example, you might have set up a segment for blog traffic. If you click User Defined, you would be able to view statistics based on people coming from this referring site, but that also that visited your blog.
Yes, Drill Into Your Reporting Even Further…
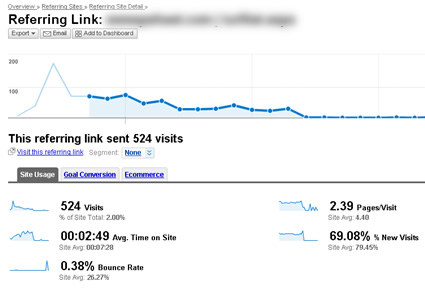
Why stop at the previous step? If you click one of the URL’s within your referring site report, you can view statistics for that one URL. You are telling GA to just give you data for that one URL and not the entire referring site. In this report, you can view trending up top for the URL in question (again, not for the entire site, just the URL). You can visit that URL in a new window, you can segment your data via the Segment dropdown, and you can view a summary of statistics at the bottom of the report. And once again, you can click each tab to view Site Usage, Goal Conversion, and E-Commerce for that one URL. Nice.
Screenshot of a Specific Link (URL) in the Referring Sites Report:
How About a Hypothetical Referring Sites Example?
You launched a big campaign last week. There are 2 sites in particular that you want to compare. Both are vying for your long-term business, so this is a test for each of them. You are running advertising on both sites in various locations. Both sites show up in your referring sites report. Great. Let’s take a closer look.
Each site sent ~8,000 visitors your way. Immediately you see that 1 site had a 55% bounce rate and the other had a 10% bounce rate. Interesting. You click Goal Conversion and see that the first site (with a high bounce rate) had a 2% conversion rate and the second site with a 10% bounce rate had an 8% conversion rate. Your case is getting stronger for site #2, right? Let’s drill deeper into site #2. You see 4 URL’s from this referring site that drove visitors to your site. The trending (up top) shows a downward trend from the day it launched through yesterday. What’s the reason? The most popular link was on their blog, which based on new content being added daily to the blog, the post mentioning your site drops down the blog homepage and eventually off of the homepage. You still get traffic, but not as much. Bookmark that in your mind for future campaigns. Maybe you should focus your efforts on more blog related content versus other efforts. You check revenue by URL, which backs up the mention in the blog post. It sent the most traffic and revenue your way. Let’s pop back out and check the first site (the one with a high bounce rate and lower conversion rate). You are now viewing the referring site by URL. Most of the visitors came through the homepage advertisement, but that also had the highest bounce rate. Was it the creative? Or, since visitors that arrived from links deeper in the site stayed longer and converted at a higher rate, does that reflect a more valuable type of visitor? For example, are you getting more value from deeper site advertising? Sure, it won’t send you as much traffic, but you want a high return on investment (ROI), which means revenue. Traffic is good, but not if 55% of it bounces.
We can keep going, but I’ll stop my hypothetical analysis here! I hope you can see how powerful this set of reports can be for determining high quality traffic. And “High Quality” can be determined by you, and not the people sending you the traffic. ;-) What gets me even more excited is that web analytics packages are only getting stronger. You will be able to do more and more as the popular analytics packages evolve. Stay tuned for more posts about other web analytics reporting. I know that there’s a lot to cover, so subscribe to my feed and keep up to date on my latest posts.
GG